ObjectExplorer
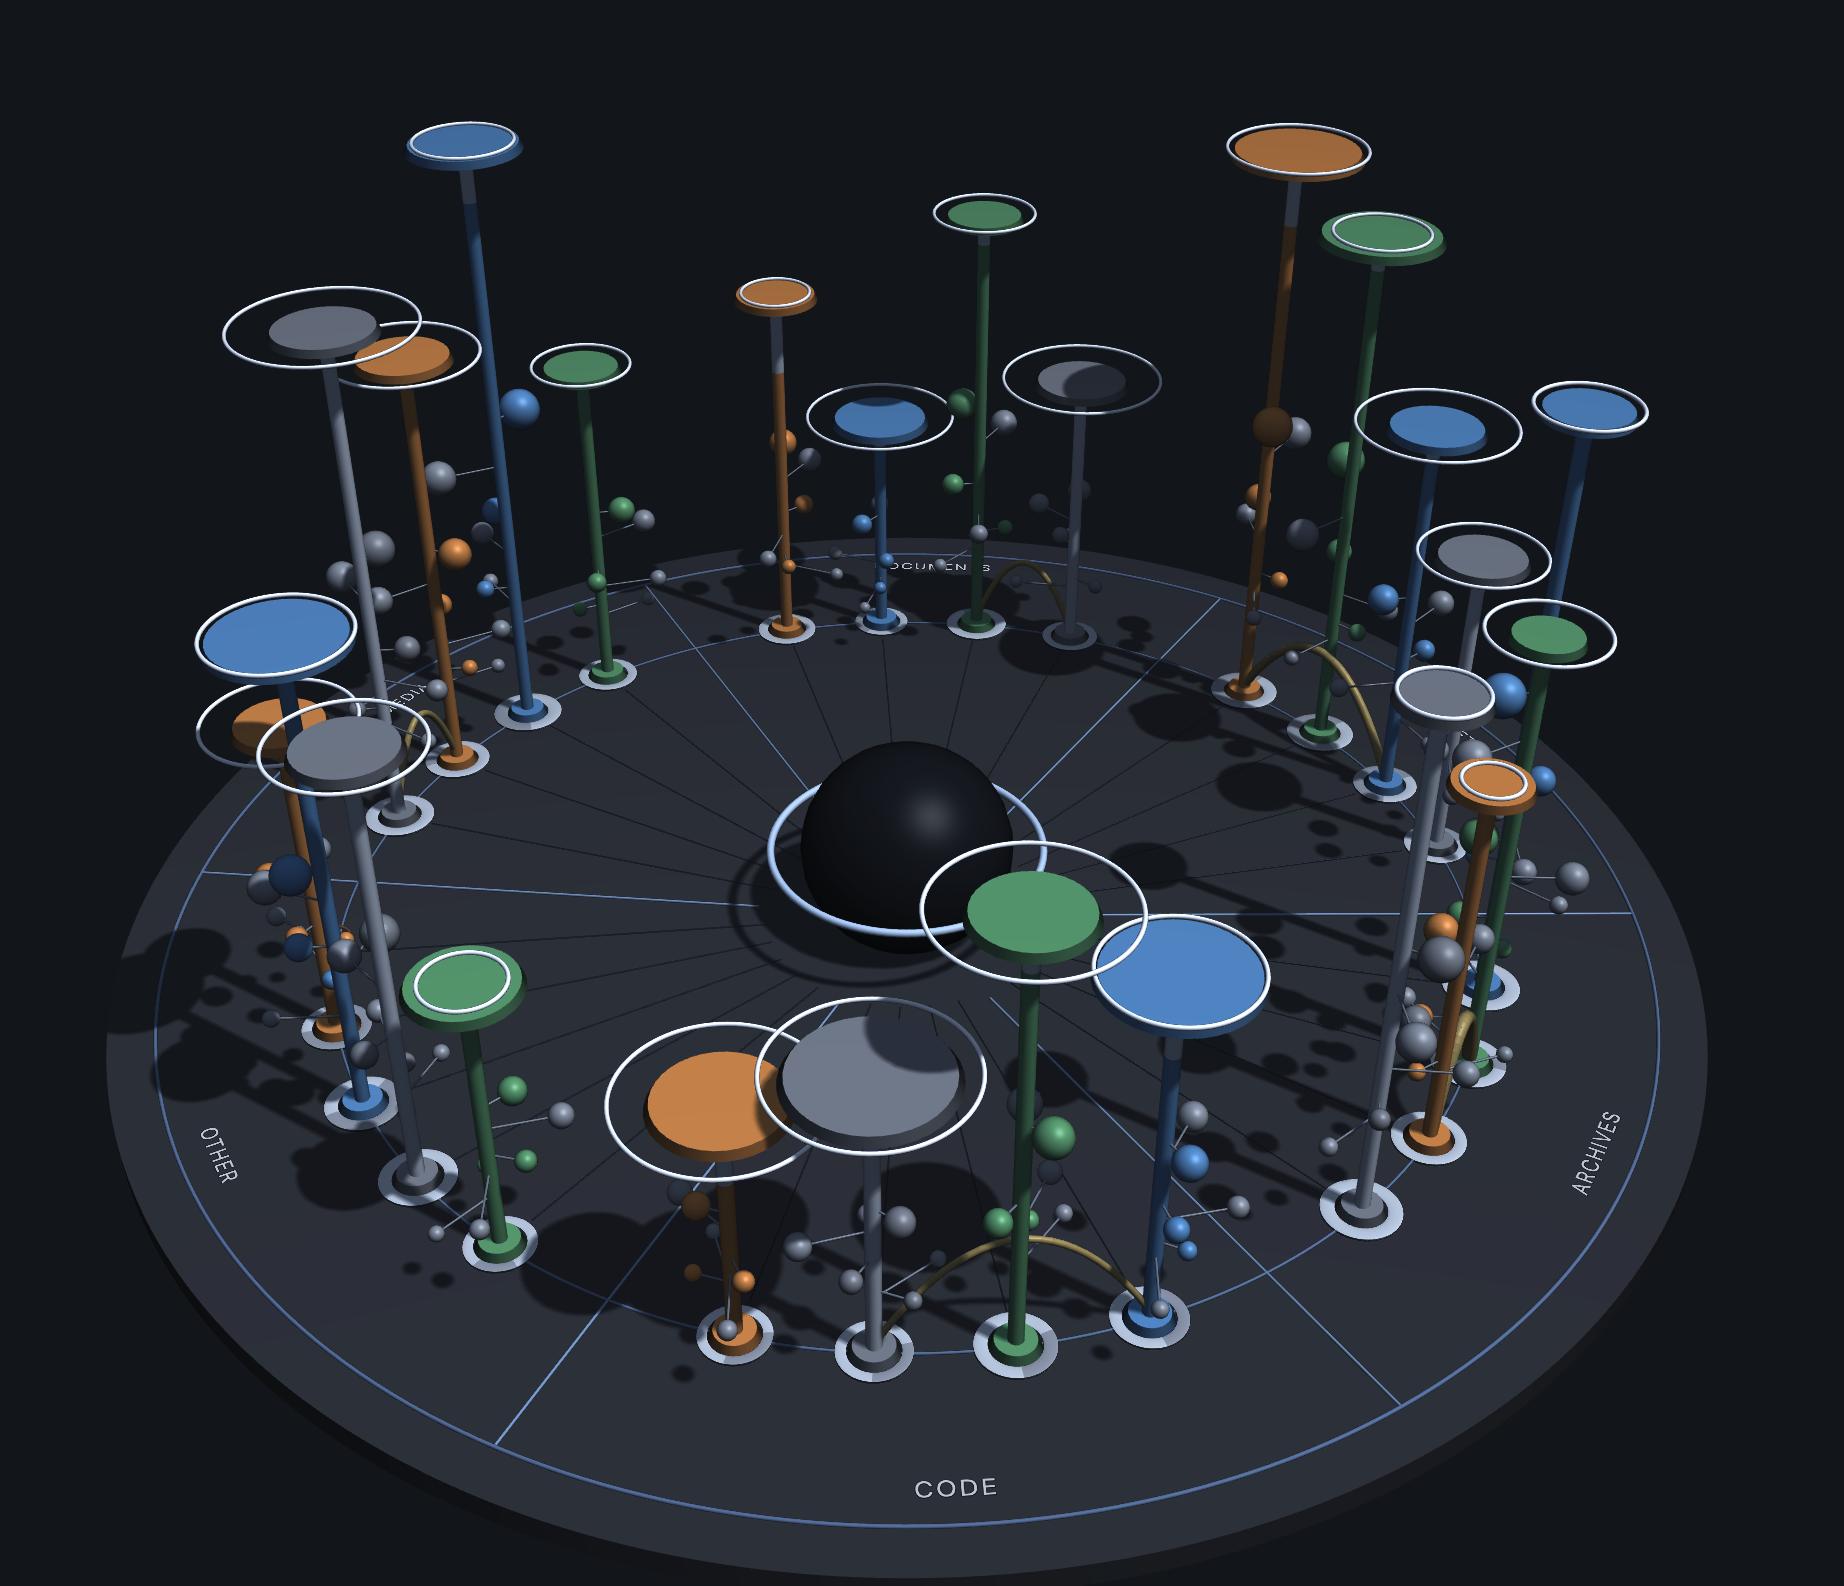
 Visualize usage shouldn't be that hard
See where our money goes
Our cloud storage bill has been going up month by month. High mangers are asking why. We'd better to figure it out.
Today
For sure there is billing console and command line tool for every cloud provider. We can click here and there, plenty of graphs. Often after an hour passed away, we still could not get concreate action points.
Why? Cloud provider don't have any incentive to help reducing cost, do they?
Billing tools are there, but the purpose certainly not help us to reduce cost. Why would they?
- Billing consoleclick here and there
- Billing consoleplenty of graphs
- Terminalone more command
- Effortan hour gone
Ideal Solution
The answers I want to have are.
- which bucket cost most
- what type of files take the most cost
- by human or agent
- duplication in different places?
- becuase or many small objects
- or large unused ones
- what should I do to reduce the cost
Answered all in one page.
Reference
NOTE: The example below are all artificial results, no real data.
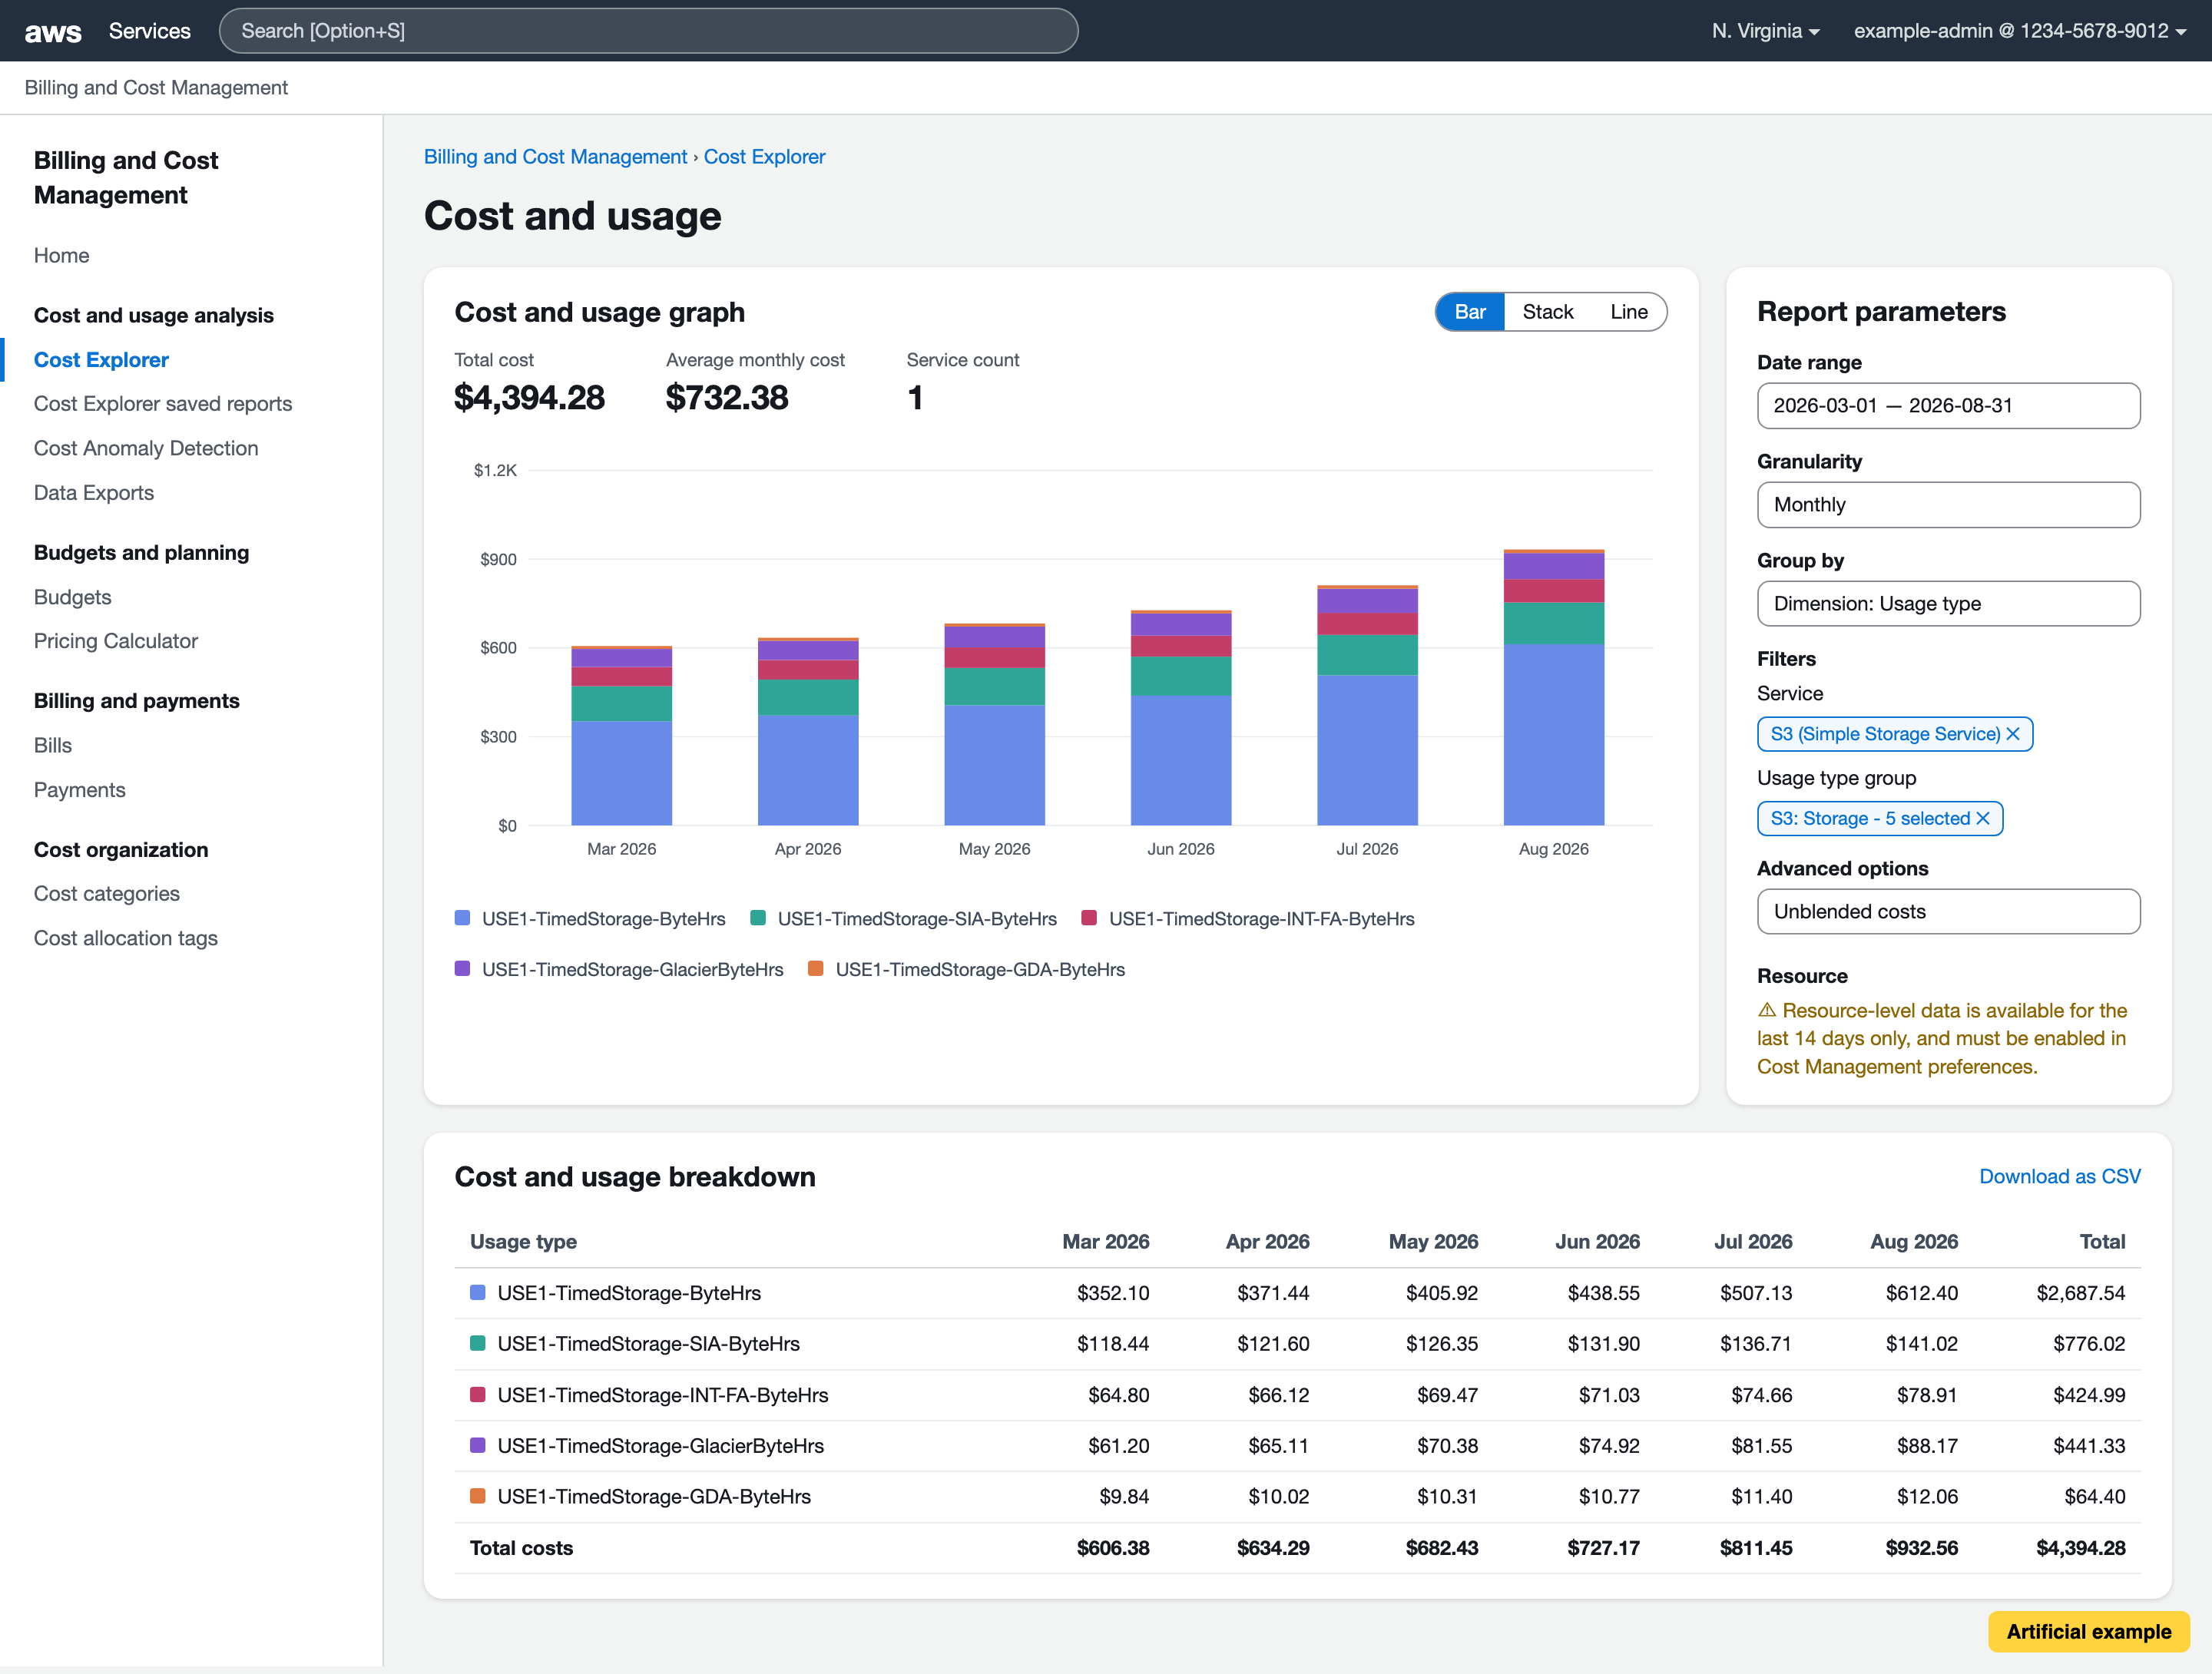
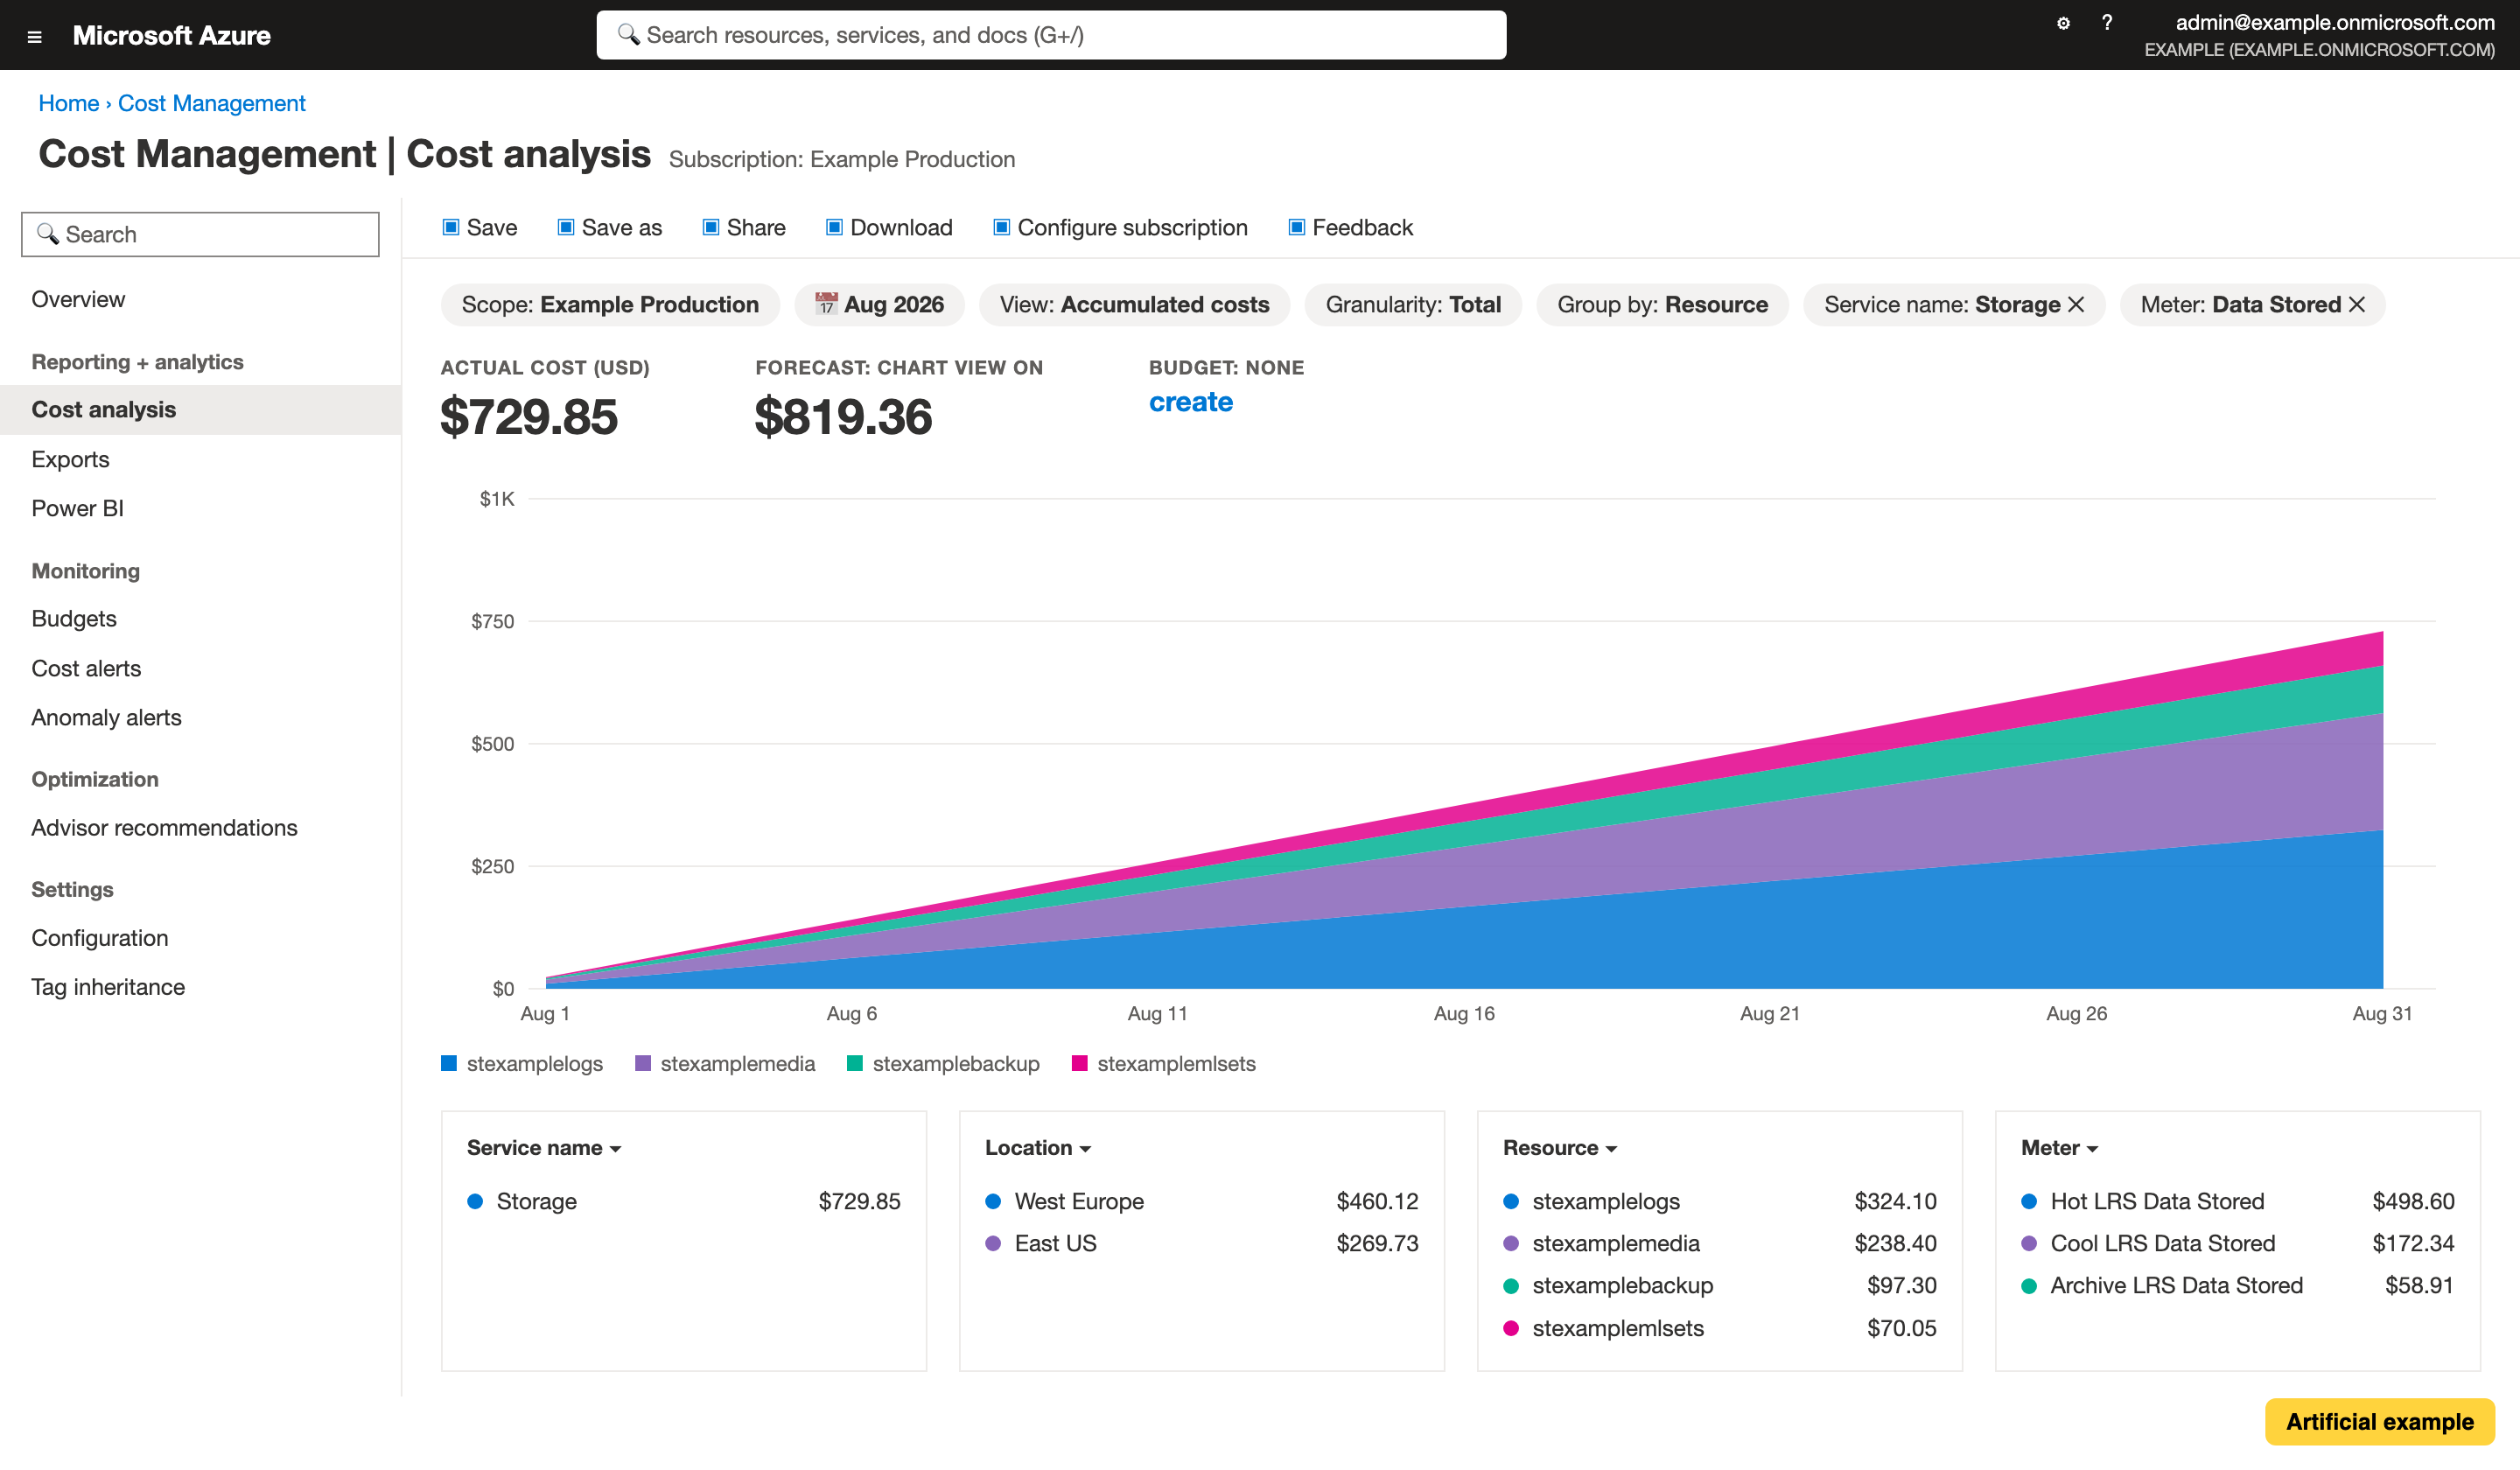
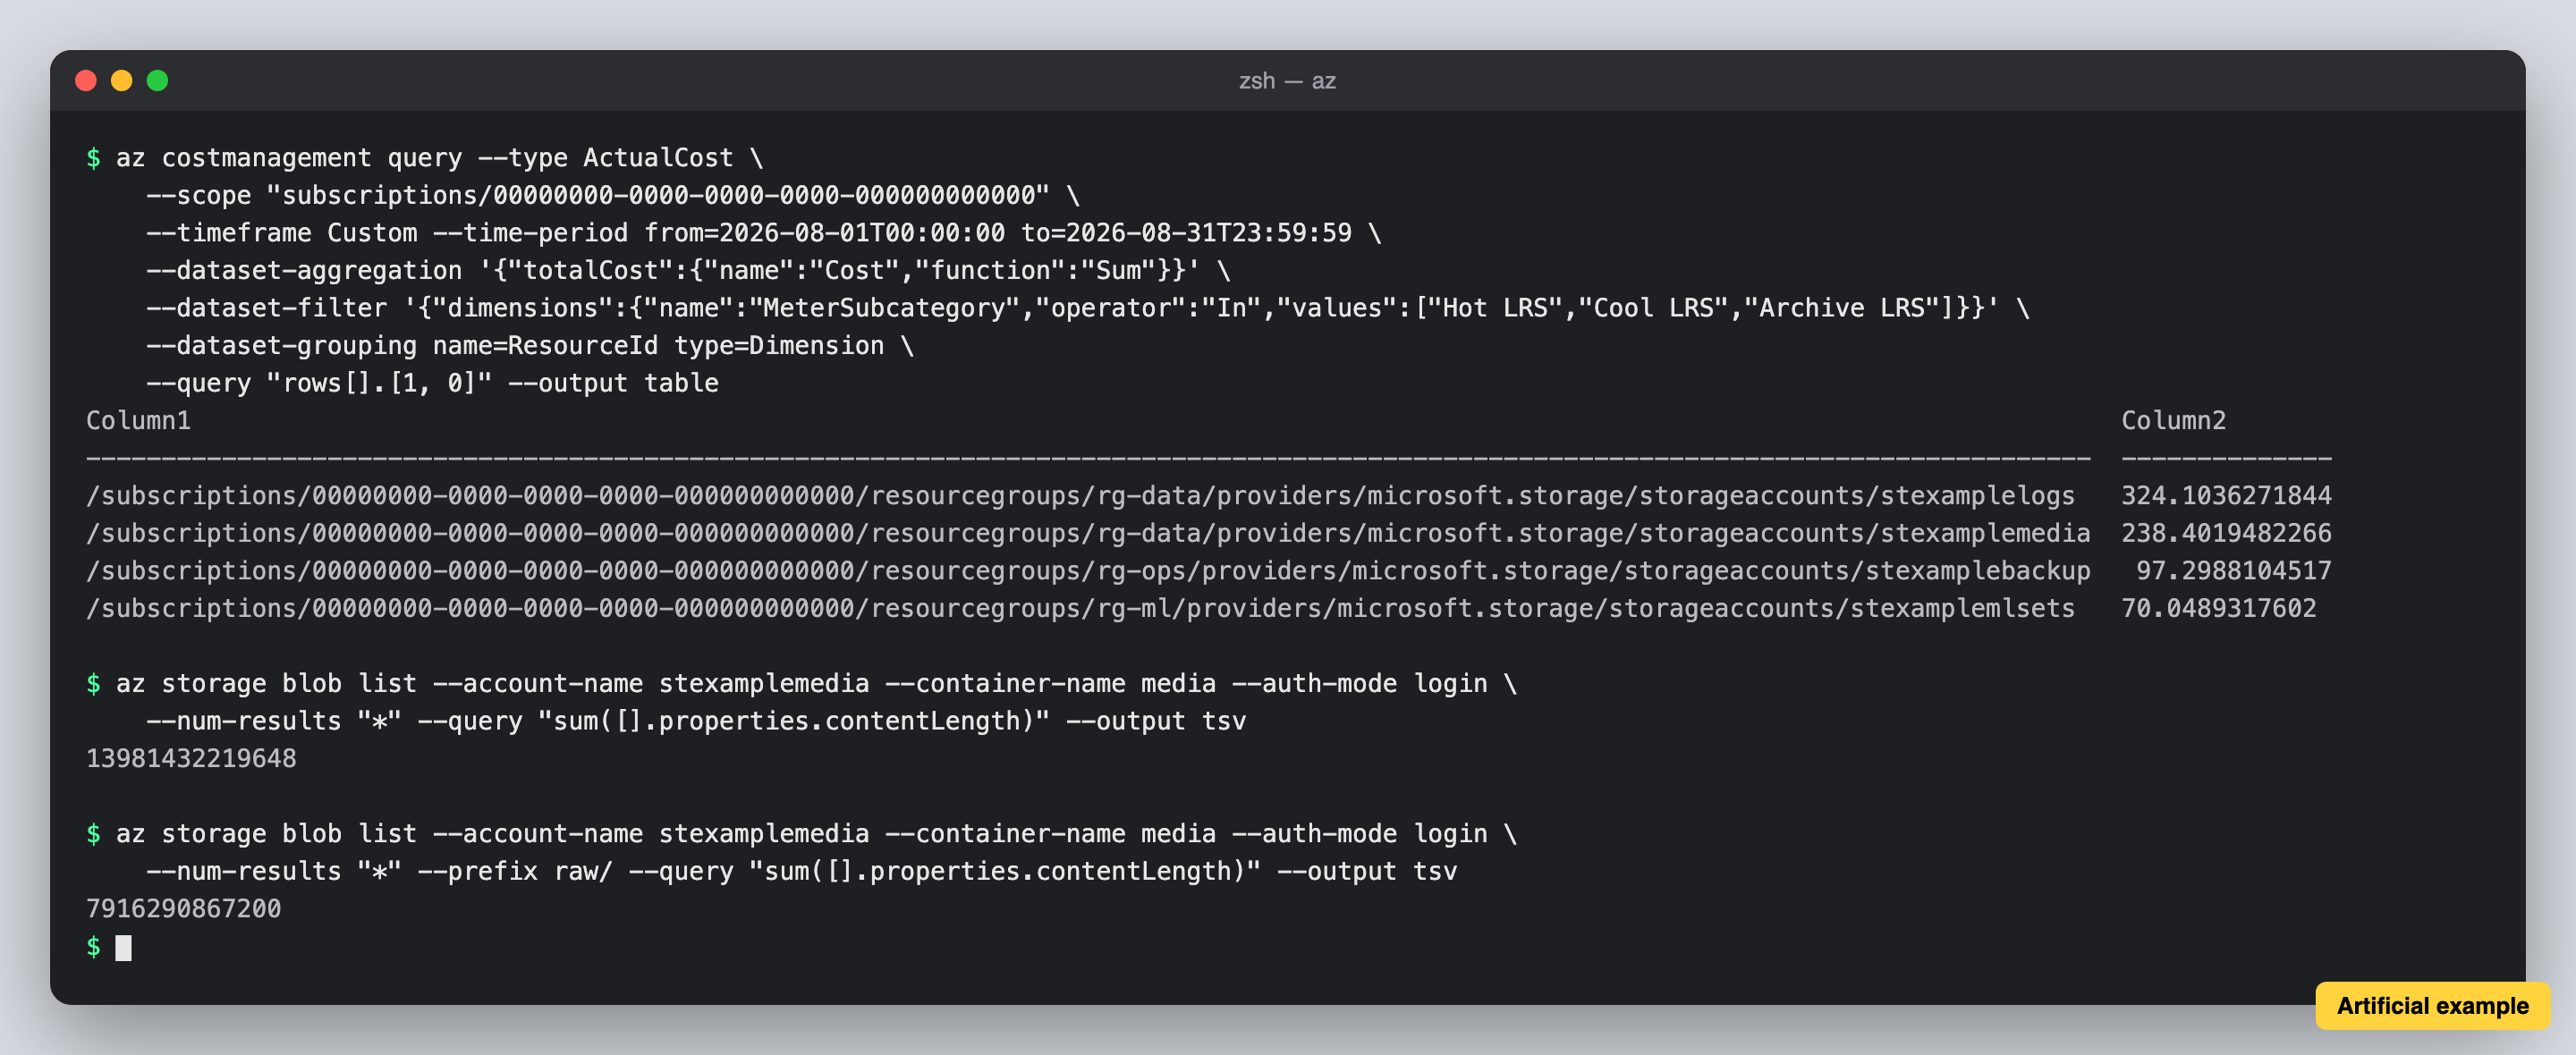
This is what Today looks like in each cloud's console and command line. These are made up, not captured from a real account. The buckets, accounts and numbers are invented to show the shape of what each console and command line gives back for storage cost. Each one is filtered to storage alone, the bytes kept per month; transfer, requests and retrieval are left out.
AWS
Cost Explorer, filtered to the S3 usage visualization types and grouped by usage type. Resource-level grouping covers only the last 14 days, and only after it is turned on.
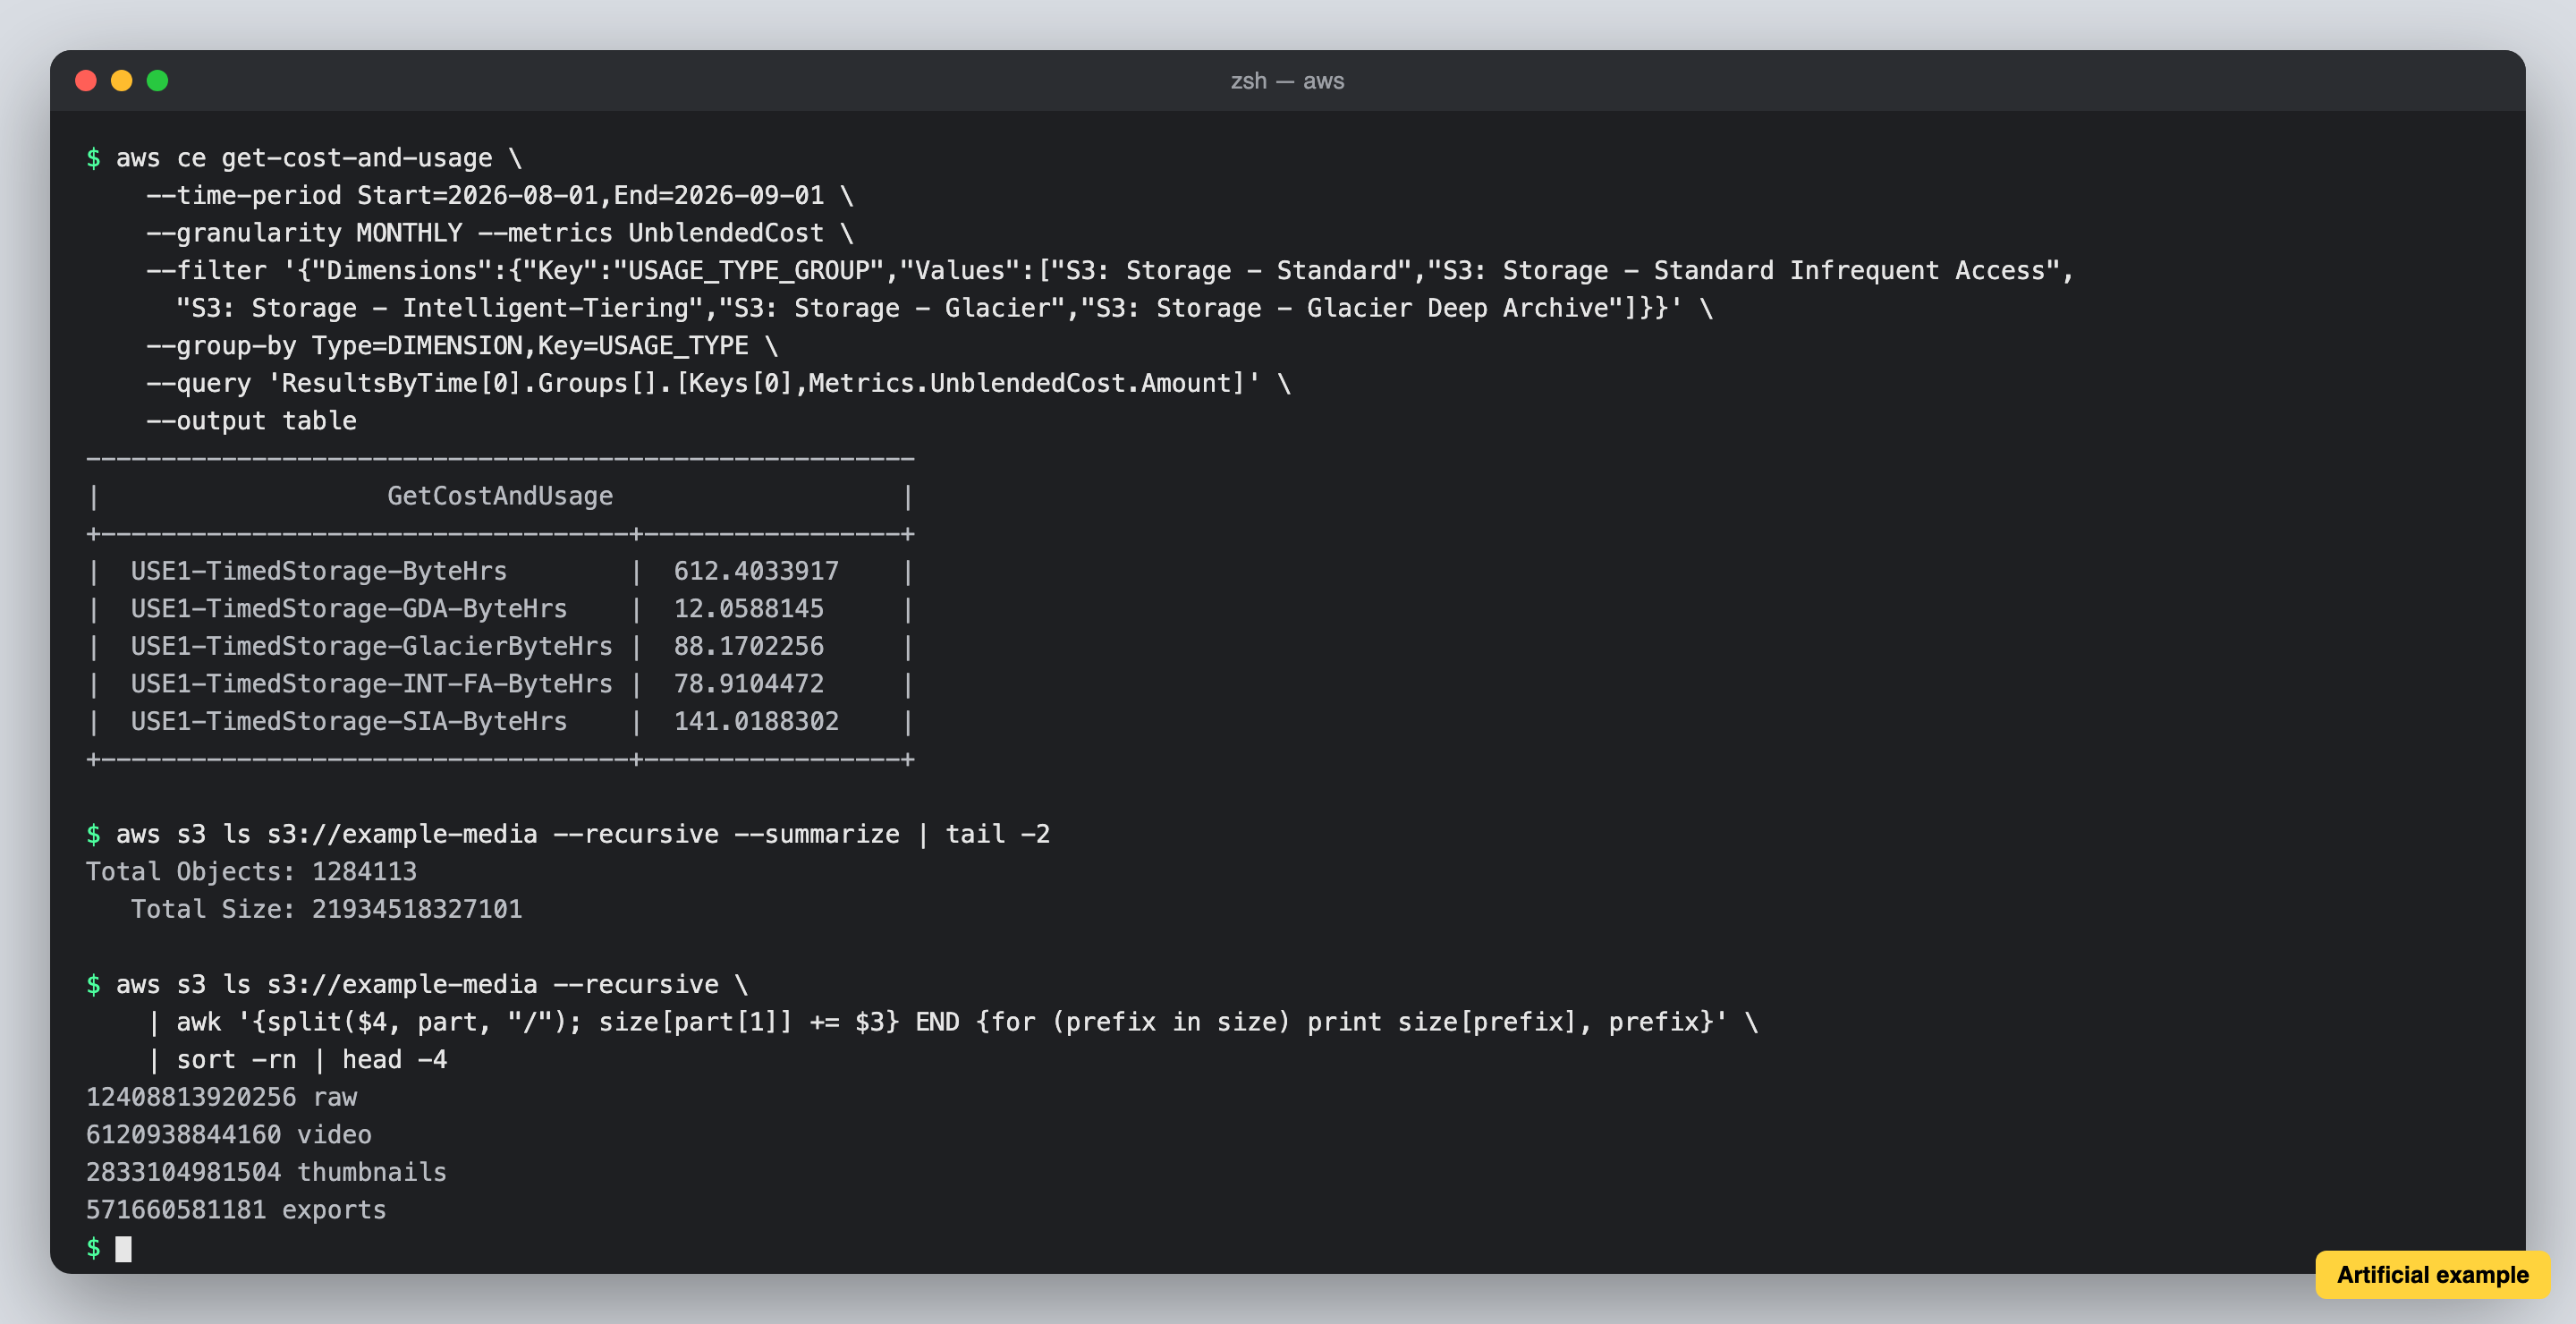
The same numbers from aws ce get-cost-and-usage, then the bucket listed and summed by prefix by hand. Nothing joins the two.
Azure
Cost analysis, filtered to the data stored meters and grouped by resource. The smallest unit is the storage account, not the container or the folder.
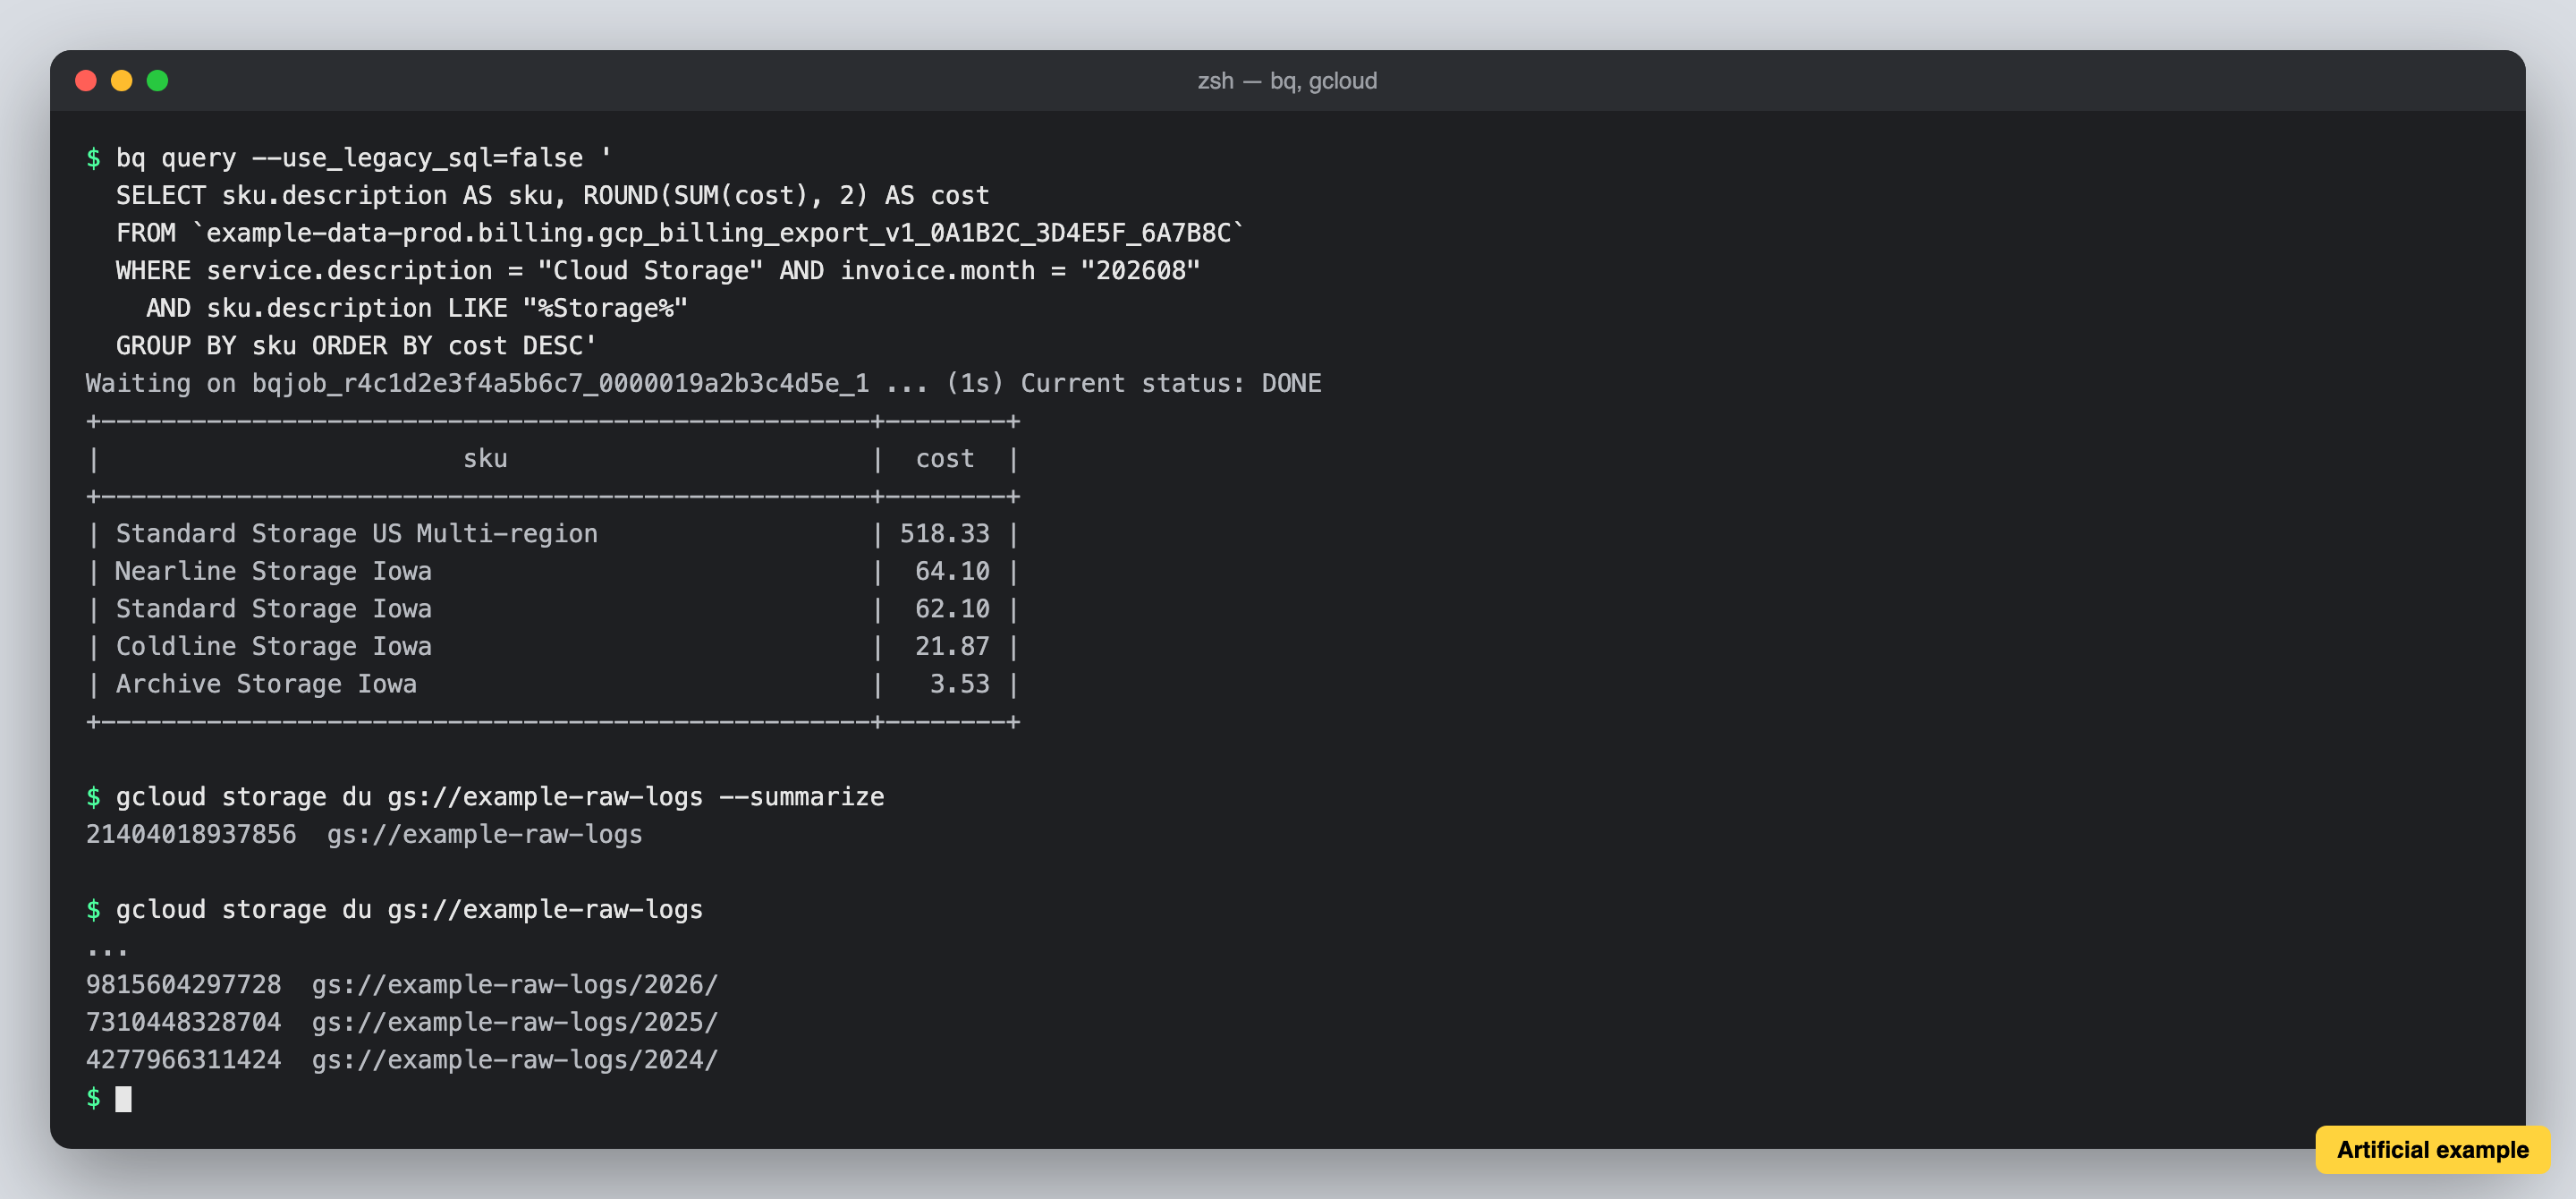
az costmanagement query filtered to the same meters and grouped by resource ID, then az storage blob list to sum sizes under a prefix.
Google Cloud
Billing Reports, filtered to the Cloud Storage storage SKUs and grouped by SKU. Group by offers service, SKU, project, location and label; there is no bucket.
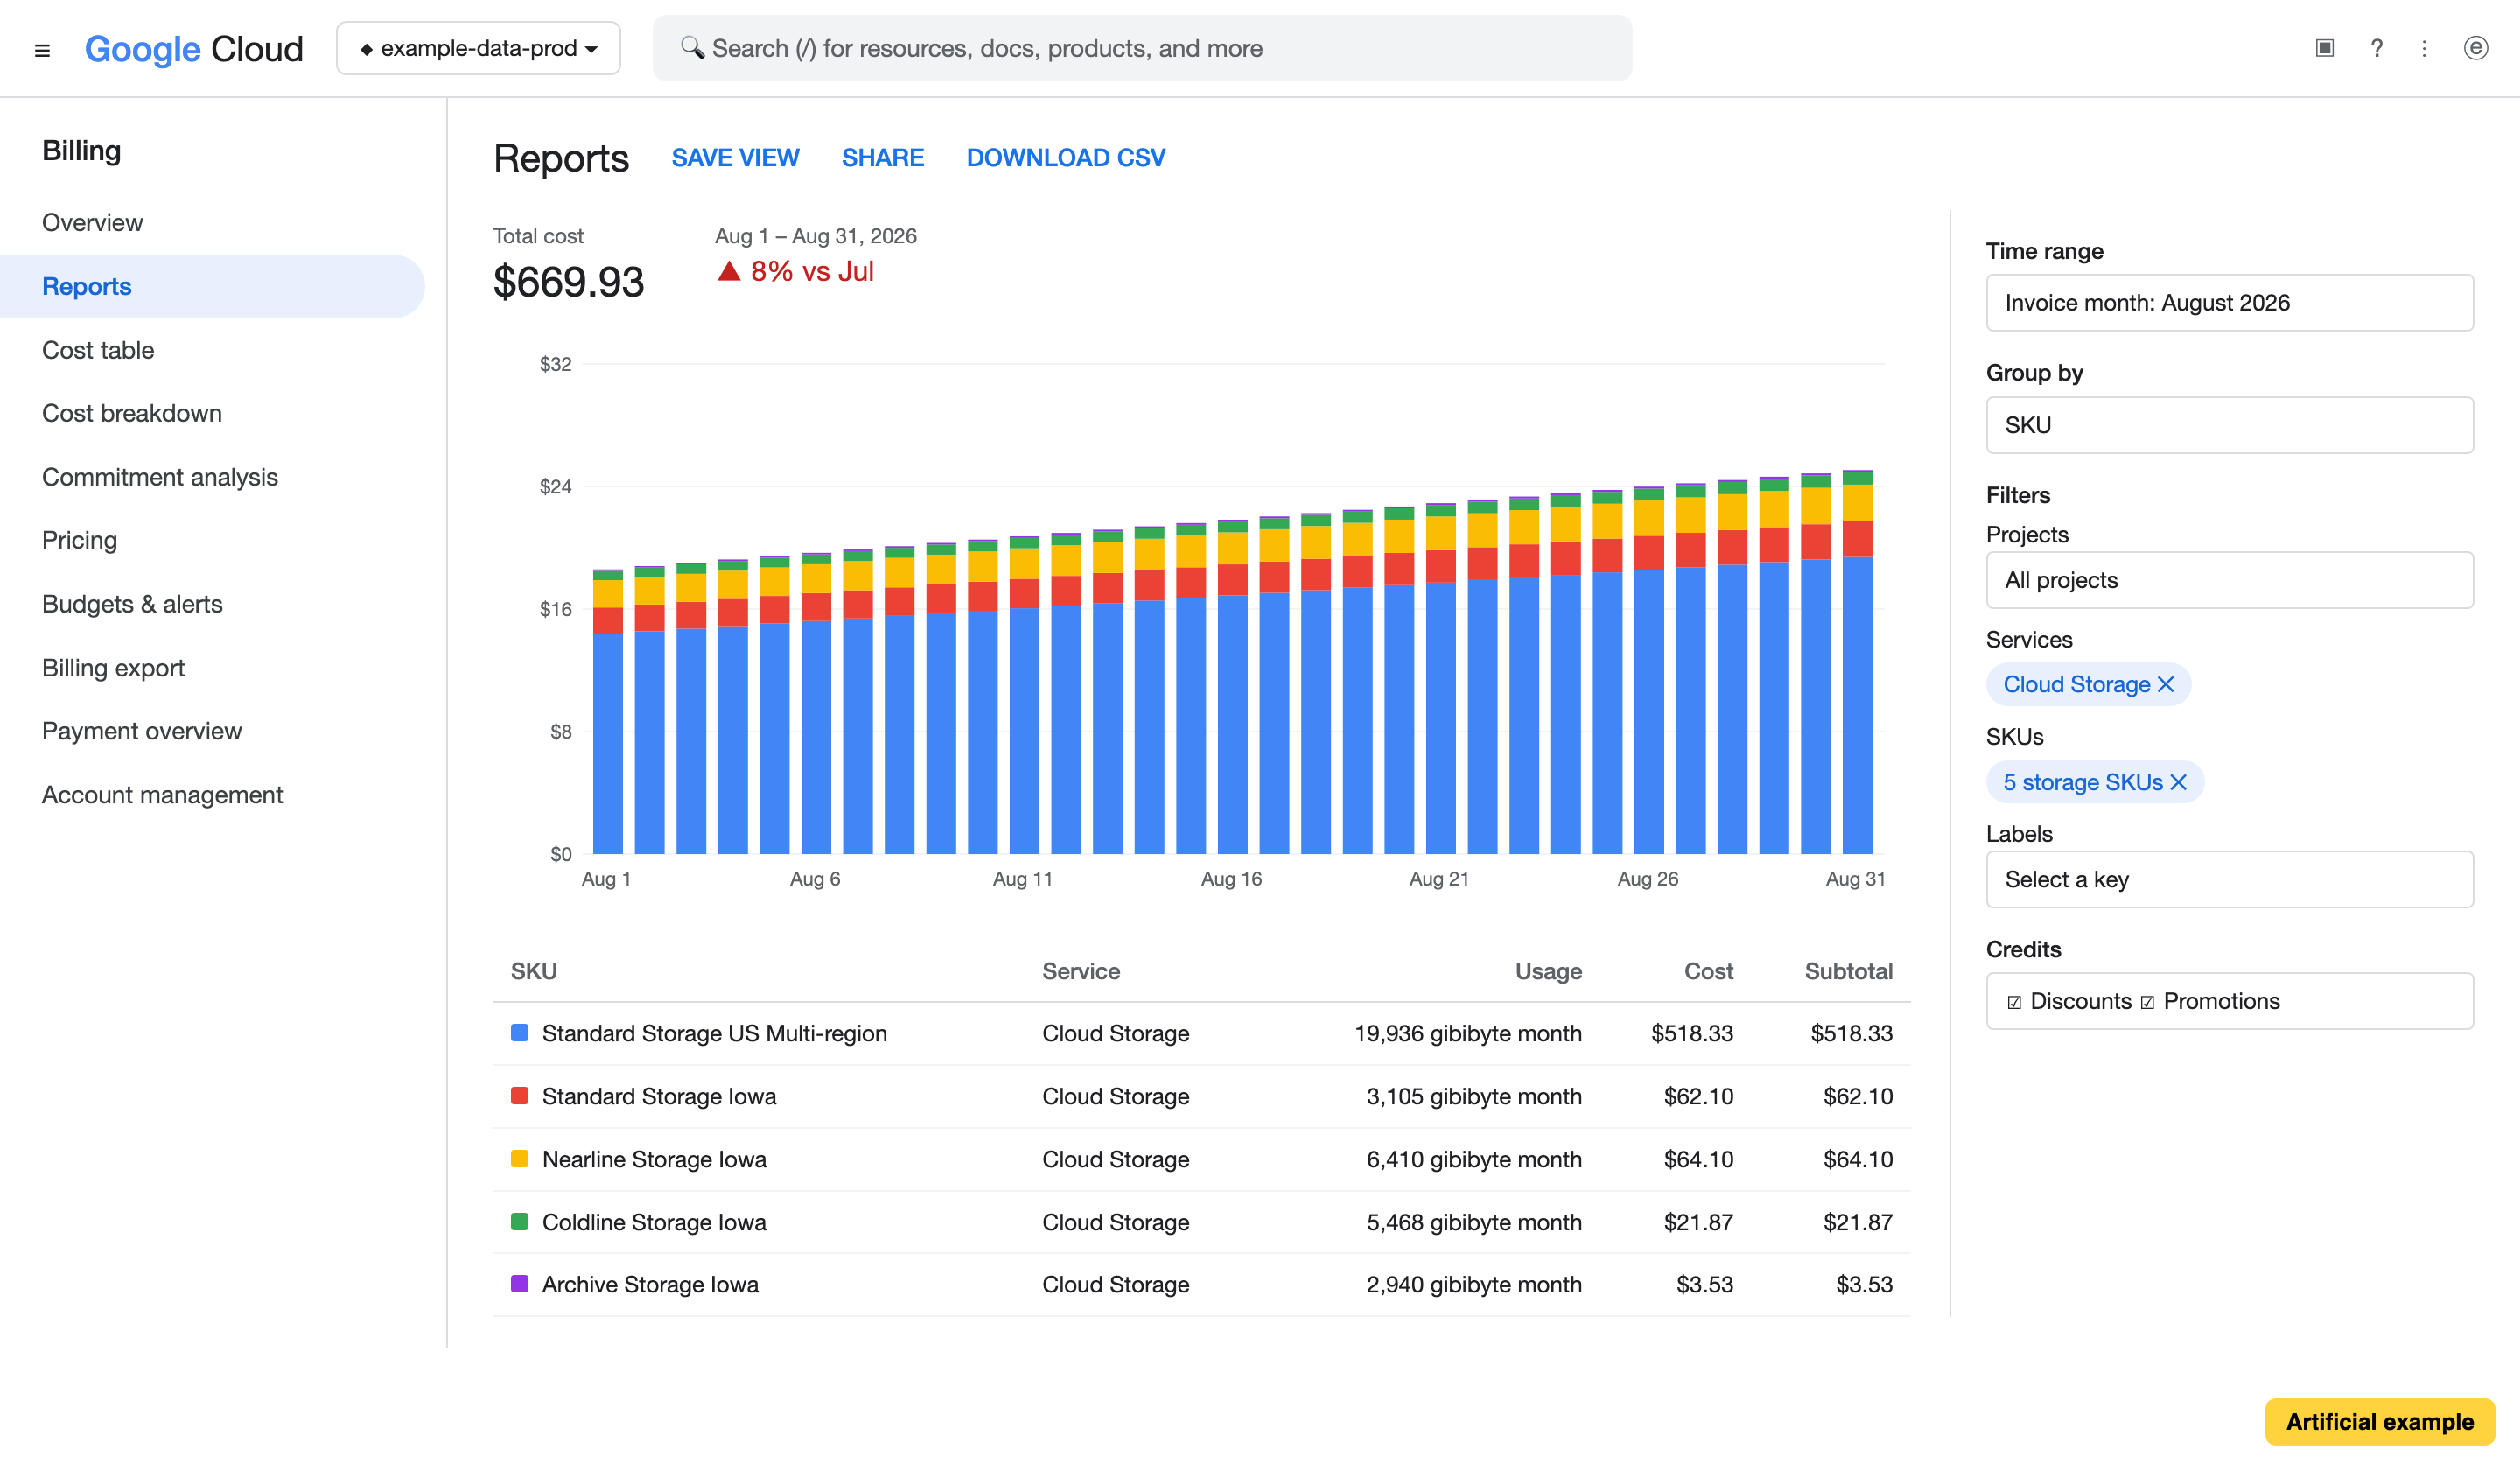
There is no gcloud command for cost. It comes from a query over the billing export in BigQuery, then gcloud storage du for the sizes.