 ObjectExplorer
 Get a column summary?
One click, full stats.
A new file landed in a bucket and someone asked me whether it was any good. I didn't want to analyse it. I wanted to know what was in each column: the range, how many were empty, whether the dates went as far as they should. I spent twenty minutes finding out that three columns were usable and the dates stopped in March.
Today
The console could tell me the file's name and size, and nothing about what was inside. So I copied its path and started a notebook. I typed the imports I have typed hundreds of times. I typed the read, with the path, and ran it and waited. I asked for a description of every column and ran that. I counted the nulls, because the description doesn't, and ran that too. Then I scrolled through the output, sideways, because the table was wide.
The answer was short. The work to get it was not. And then I closed the notebook and didn't come back to it, because the file wasn't worth it.
- Cloud consolecopy the path
- Notebooktype the imports
- Notebookread the file
- Notebookdescribe, count nulls
- Notebookclose it
Nothing went wrong in any of that. The notebook is a fine place to do analysis. The problem is that I wasn't doing analysis. I was looking. Every step assumed that learning the shape of a file means writing a program about it.
Ideal
So where do those numbers come from? The rows. The smallest value and the largest, how many are empty, how many are different from each other, which ones come up most. None of it needs a model or a formula. It is counting.
And here is the part I think is easy to miss. To show me a table at all, something already has to read the rows and put them on the screen. If it is reading them anyway, it can count while it reads. The summary costs one more pass over values that are already in memory.
The one real decision is what kind of column it is, because a count of distinct names and a range of prices need different pictures. That can be decided from a small sample, and then every value is counted once, properly.
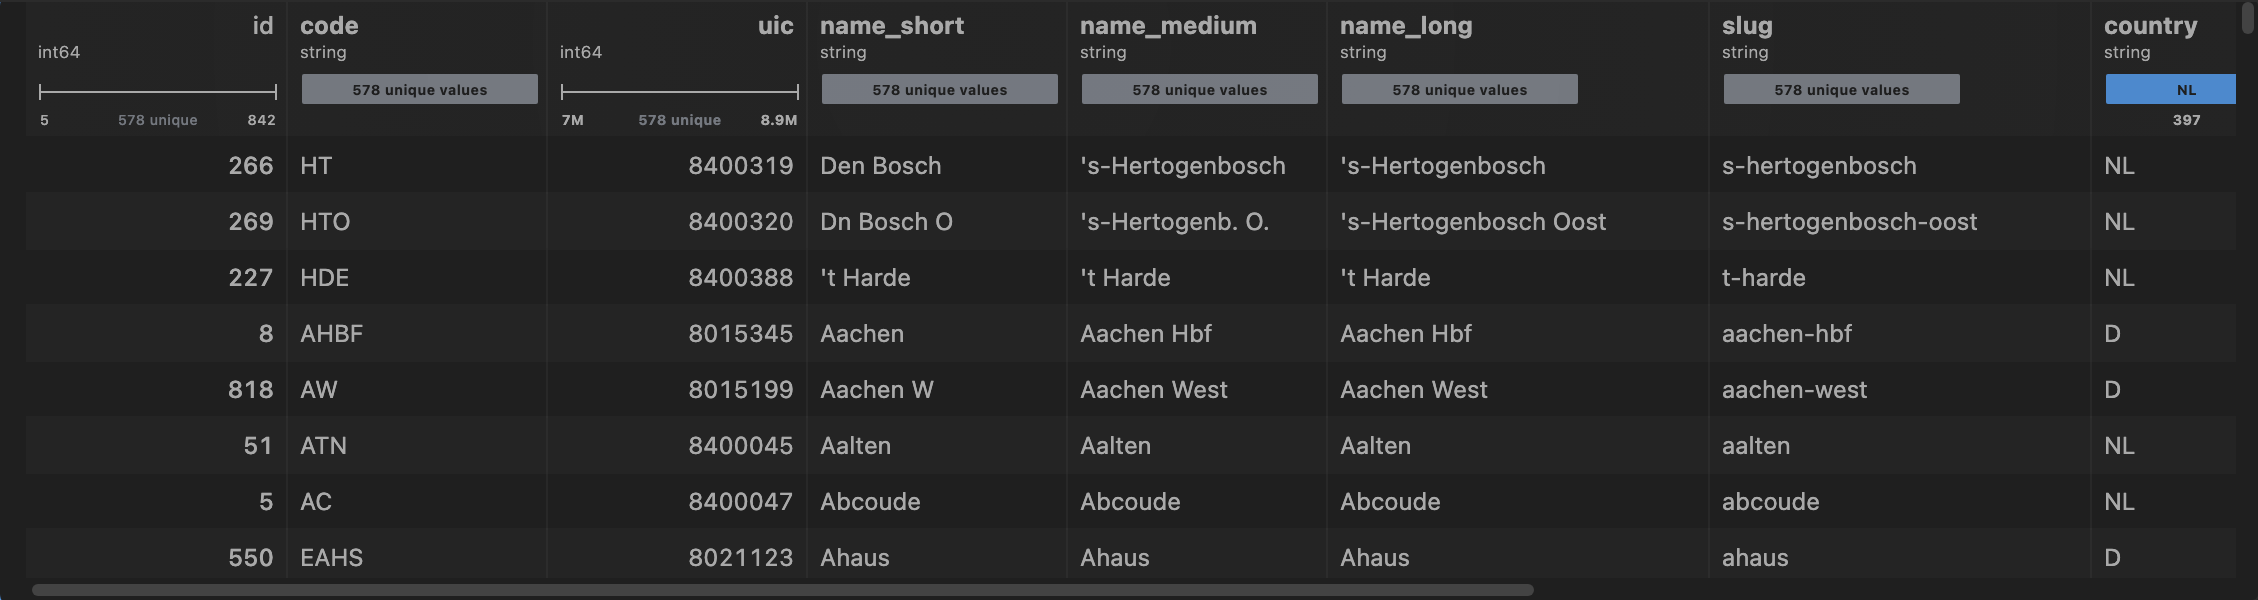
That is a file of Dutch and European train stations, opened as a table. Above each column name sits its summary. In the code, the type is picked from a sample of 500 values, then every loaded value is walked once for the row count, the null count, the distinct count, the minimum, quartiles, median, maximum and average, and the six most common values for text. A column with twelve or fewer distinct values shows each one. The id column's range, 5 to 842, and the 397 rows marked NL are read straight off the header.
Where it stops
The summary is over the rows that were loaded, not always the whole file. When a parquet file opens as a table, the view reads its first row group and shows at most 1,024 rows; a query brings back at most 10,000. For this file that is every row. For a file of fifty million rows, it is a first look, and the numbers describe that first look. A full count over every row is a query, and it takes as long as reading the file takes.
I think that is the right trade for a glance. But it is a trade, and on a big file I would want to remember that I am looking at the front of it.
One click, full stats.