 ObjectExplorer
 Train a model?
Choose data, one click to train.
I had forty thousand rows on my screen and one question about them: which of these columns predicts the one at the end? It is a small question and an old one. I spent the afternoon installing things.
Today
The rows were already open in front of me. But the thing showing them could only show them, so I started a notebook. I installed the library I wanted. It needed a compiler I didn't have, and the error said so in a way that took a while to read. I installed a different library that shipped ready to run. I loaded the rows again, this time from a file, and fitted a model. Then I plotted which columns mattered.
The answer was useful. I took a screenshot of the chart and pasted it into the team chat, and as far as I know that is where the model lives now. Nobody can rerun it, change a setting, or ask it about a single row.
- Notebookinstall a library
- Terminalcompiler missing
- Notebookinstall another
- Notebookfit, plot
- Chatpaste a screenshot
None of the tools were bad. The libraries are excellent. The notebook worked once it had what it needed. The shared assumption was that training a model is a separate activity, done in a separate place, by someone who first builds that place.
Ideal
So I tried to start from what fitting a model is. For this kind of question, a gradient boosted tree model is the usual answer: it builds a few hundred small decision trees, each one correcting the last. That is arithmetic over rows. A lot of it, but a laptop does a lot of arithmetic.
And the rows were already there. To show them to me, something had loaded them and measured each column: which ones are numbers, which ones are categories. That is most of the preparation a model needs. The rest is a handful of settings: how big each tree can grow, how fast it learns, how many trees to build.
What I wanted from the model was also small. Which columns matter, ranked. And for one row I picked, why the model said what it said about that row. The second one is harder to compute than it sounds, but there is a known, exact method for trees, from the SHAP work, that splits one prediction into a contribution per column.
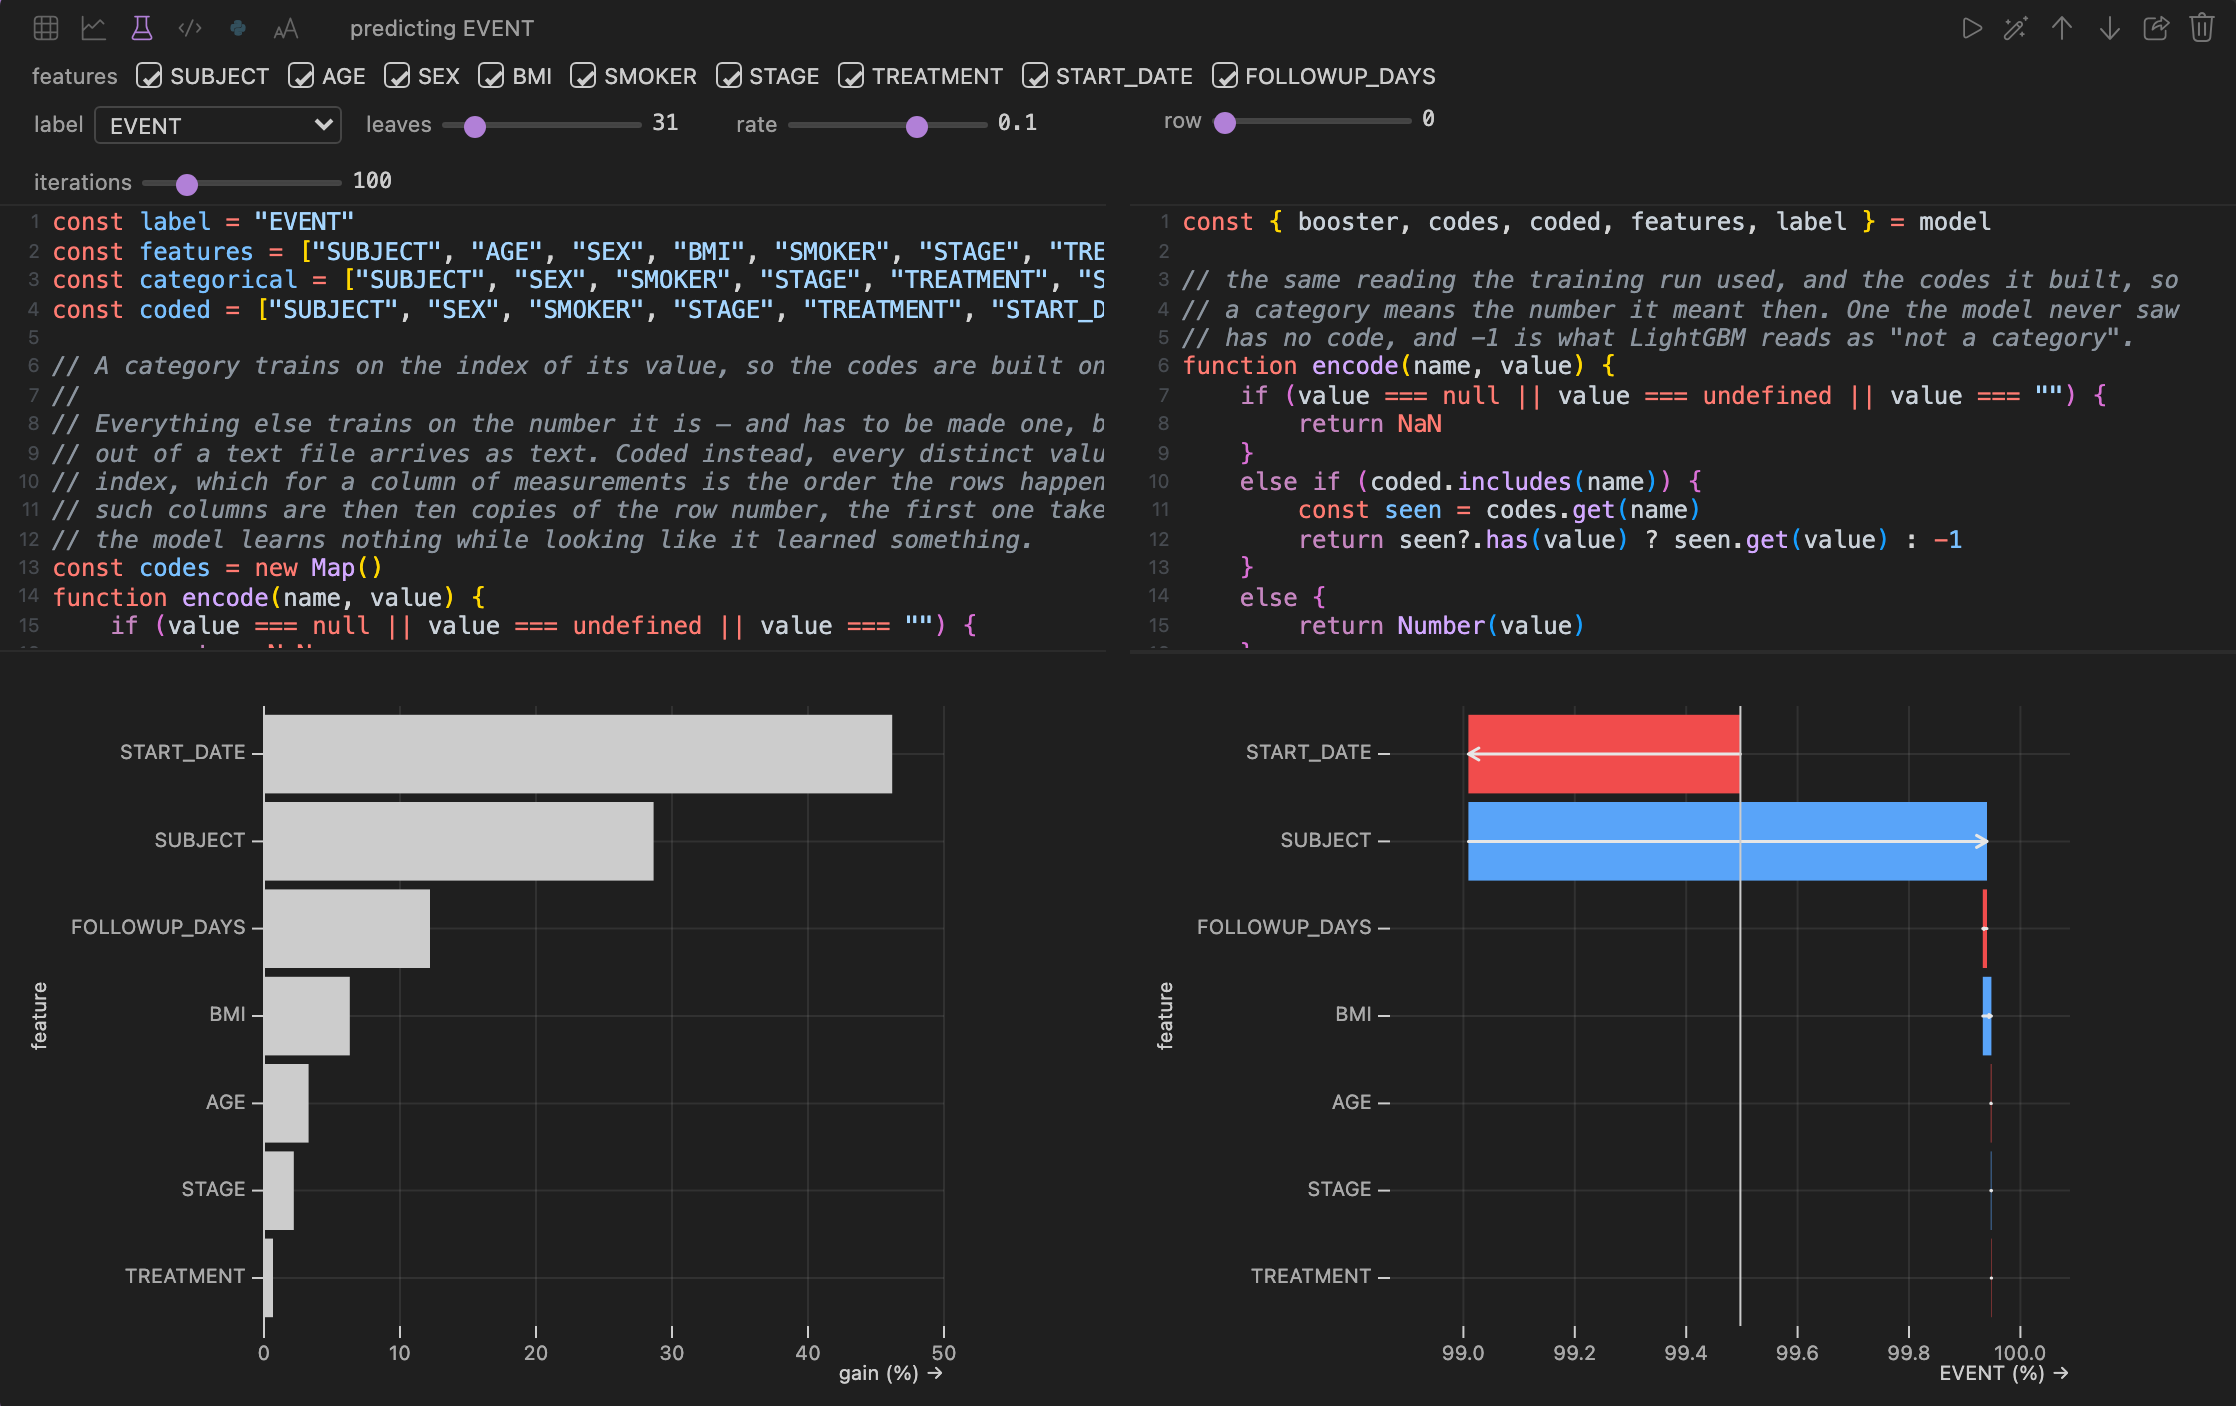
That is a model trained in the page on the rows of the cell above it. The trainer is LightGBM compiled to WebAssembly, so it runs in the browser tab. It picks regression when the label is a number and multiclass when it is a category. The three sliders are the settings above: leaves from 2 to 255, a learning rate of 0.01, 0.03, 0.1 or 0.3, and 10 to 500 iterations, and each one writes its value into the training code shown under it. The row slider picks a row and explains it with the tree SHAP method, without retraining. And a trained model can be shared as the model's own text, without the rows it learned from.
Where it stops
The rows are what the cell above holds, and a query brings back at most 10,000 of them. For forty thousand rows that means training on a quarter of them unless I aggregate or sample first. The page is also a browser tab, with a browser tab's memory.
And it is one kind of model. Boosted trees answer "which columns predict this one" well. They are not the answer to every question, and I would not want the ease of a slider to hide that.
Choose data, one click to train.