 ObjectExplorer
 Power BI
pbix pbit
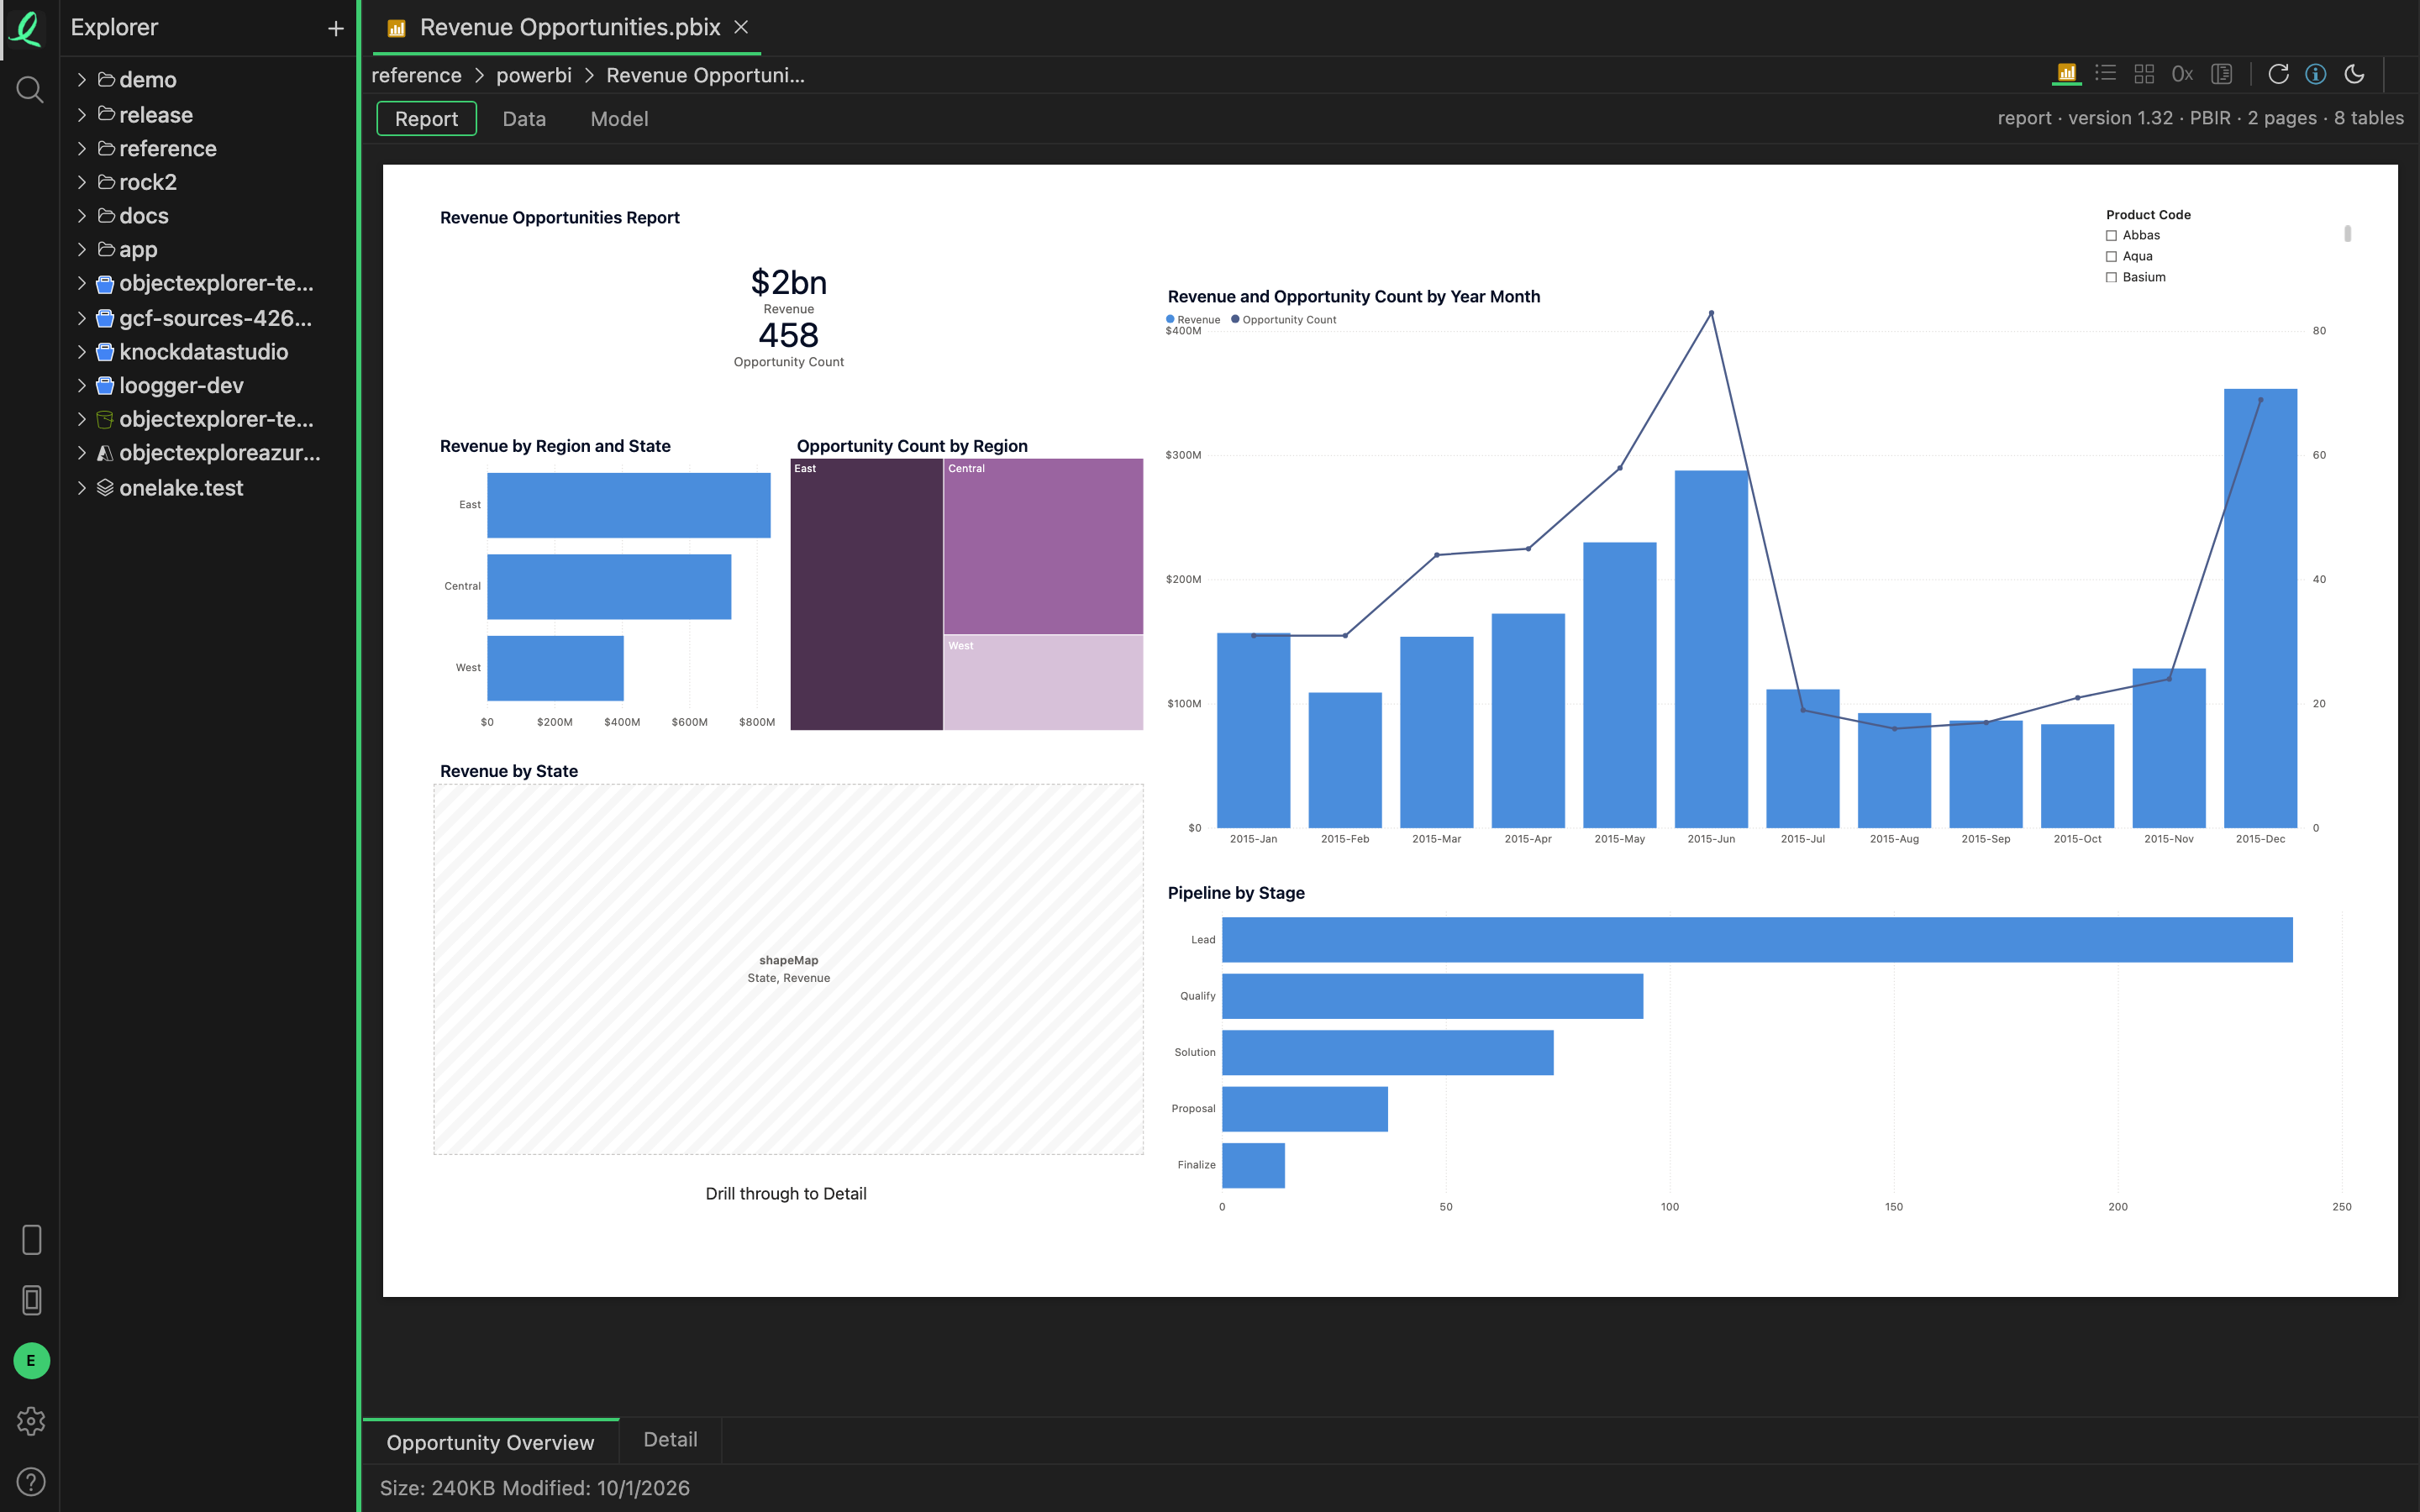
A Power BI report opens as the report: its pages, laid out where the author put every visual, with the numbers each one shows worked out from the data the file carries. Power BI Desktop is not needed, and nothing is sent to the Power BI service — the file is read in a worker on your machine, like every other one.
The report
The page tabs sit under the page, as in Power BI, and the page scales to fit the pane. Hidden pages are left out.
| Drawn as itself | Visual types |
|---|---|
| Charts | bar, column, stacked, clustered and 100%, line, area, line and column combo (the line on its own axis), ribbon, waterfall, scatter |
| Round and filled | pie, donut, funnel, treemap, gauge |
| Numbers | card, the new card, multi-row card, KPI |
| Tables | table and matrix, in the colours the author gave them |
| Slicers | the values with the saved selection ticked; a range slicer shows its range |
| Everything else on the page | text boxes, images, shapes, lines, buttons, page backgrounds and background images |
Every visual is computed under the filters the report saved: report, page and visual filters, and the selections of the page's slicers. A measure written in DAX is evaluated — CALCULATE, FILTER, ALL, the X iterators, DIVIDE, SWITCH, VAR, year to date and same period last year, and most of the rest. A measure that uses something the evaluator does not cover shows as blank rather than as a wrong number, and the visual says which function stopped it.
Maps and custom visuals are drawn as a box naming the visual and its fields, so the page keeps its layout. Clicking a visual does not filter the others yet.
Data and Model
Data lists the model's tables with their row counts, and shows the first rows of the one you pick. Model shows every table with its columns and types, the measures with their DAX, the relationships between the tables, and the Power Query that loads them.
Which files
| File | What opens |
|---|---|
.pbix with its data | the report, computed from the data inside — the usual case |
.pbix from 2016 | the same; the older way those files store their data is read too |
.pbix in PBIR | the same; PBIR is the report format Power BI saves since 2026 |
.pbit template | the pages with their fields, and the model and its queries — a template has no data |
| live connection | the pages with their fields, and where the model lives — the data is not in the file |
| DirectQuery | the pages and the model; the rows stay in the source database |
A report renamed to .bin, or saved with no extension, still opens as a report: the bytes are read, not only the name. See what decides the viewer.
Inside the file
A .pbix is a zip. The list and grid modes browse it as a folder — the layout, the themes, the images, the data model — and Structure mode shows its byte layout, down to each compressed block of the data model.
Next: the PDF reader.