 ObjectExplorer
 Memory
The Memory item in the activity bar shows what the app's memory was made of around each file you opened: how much a file cost to open, what it still holds, and what was given back when its tab was put away.
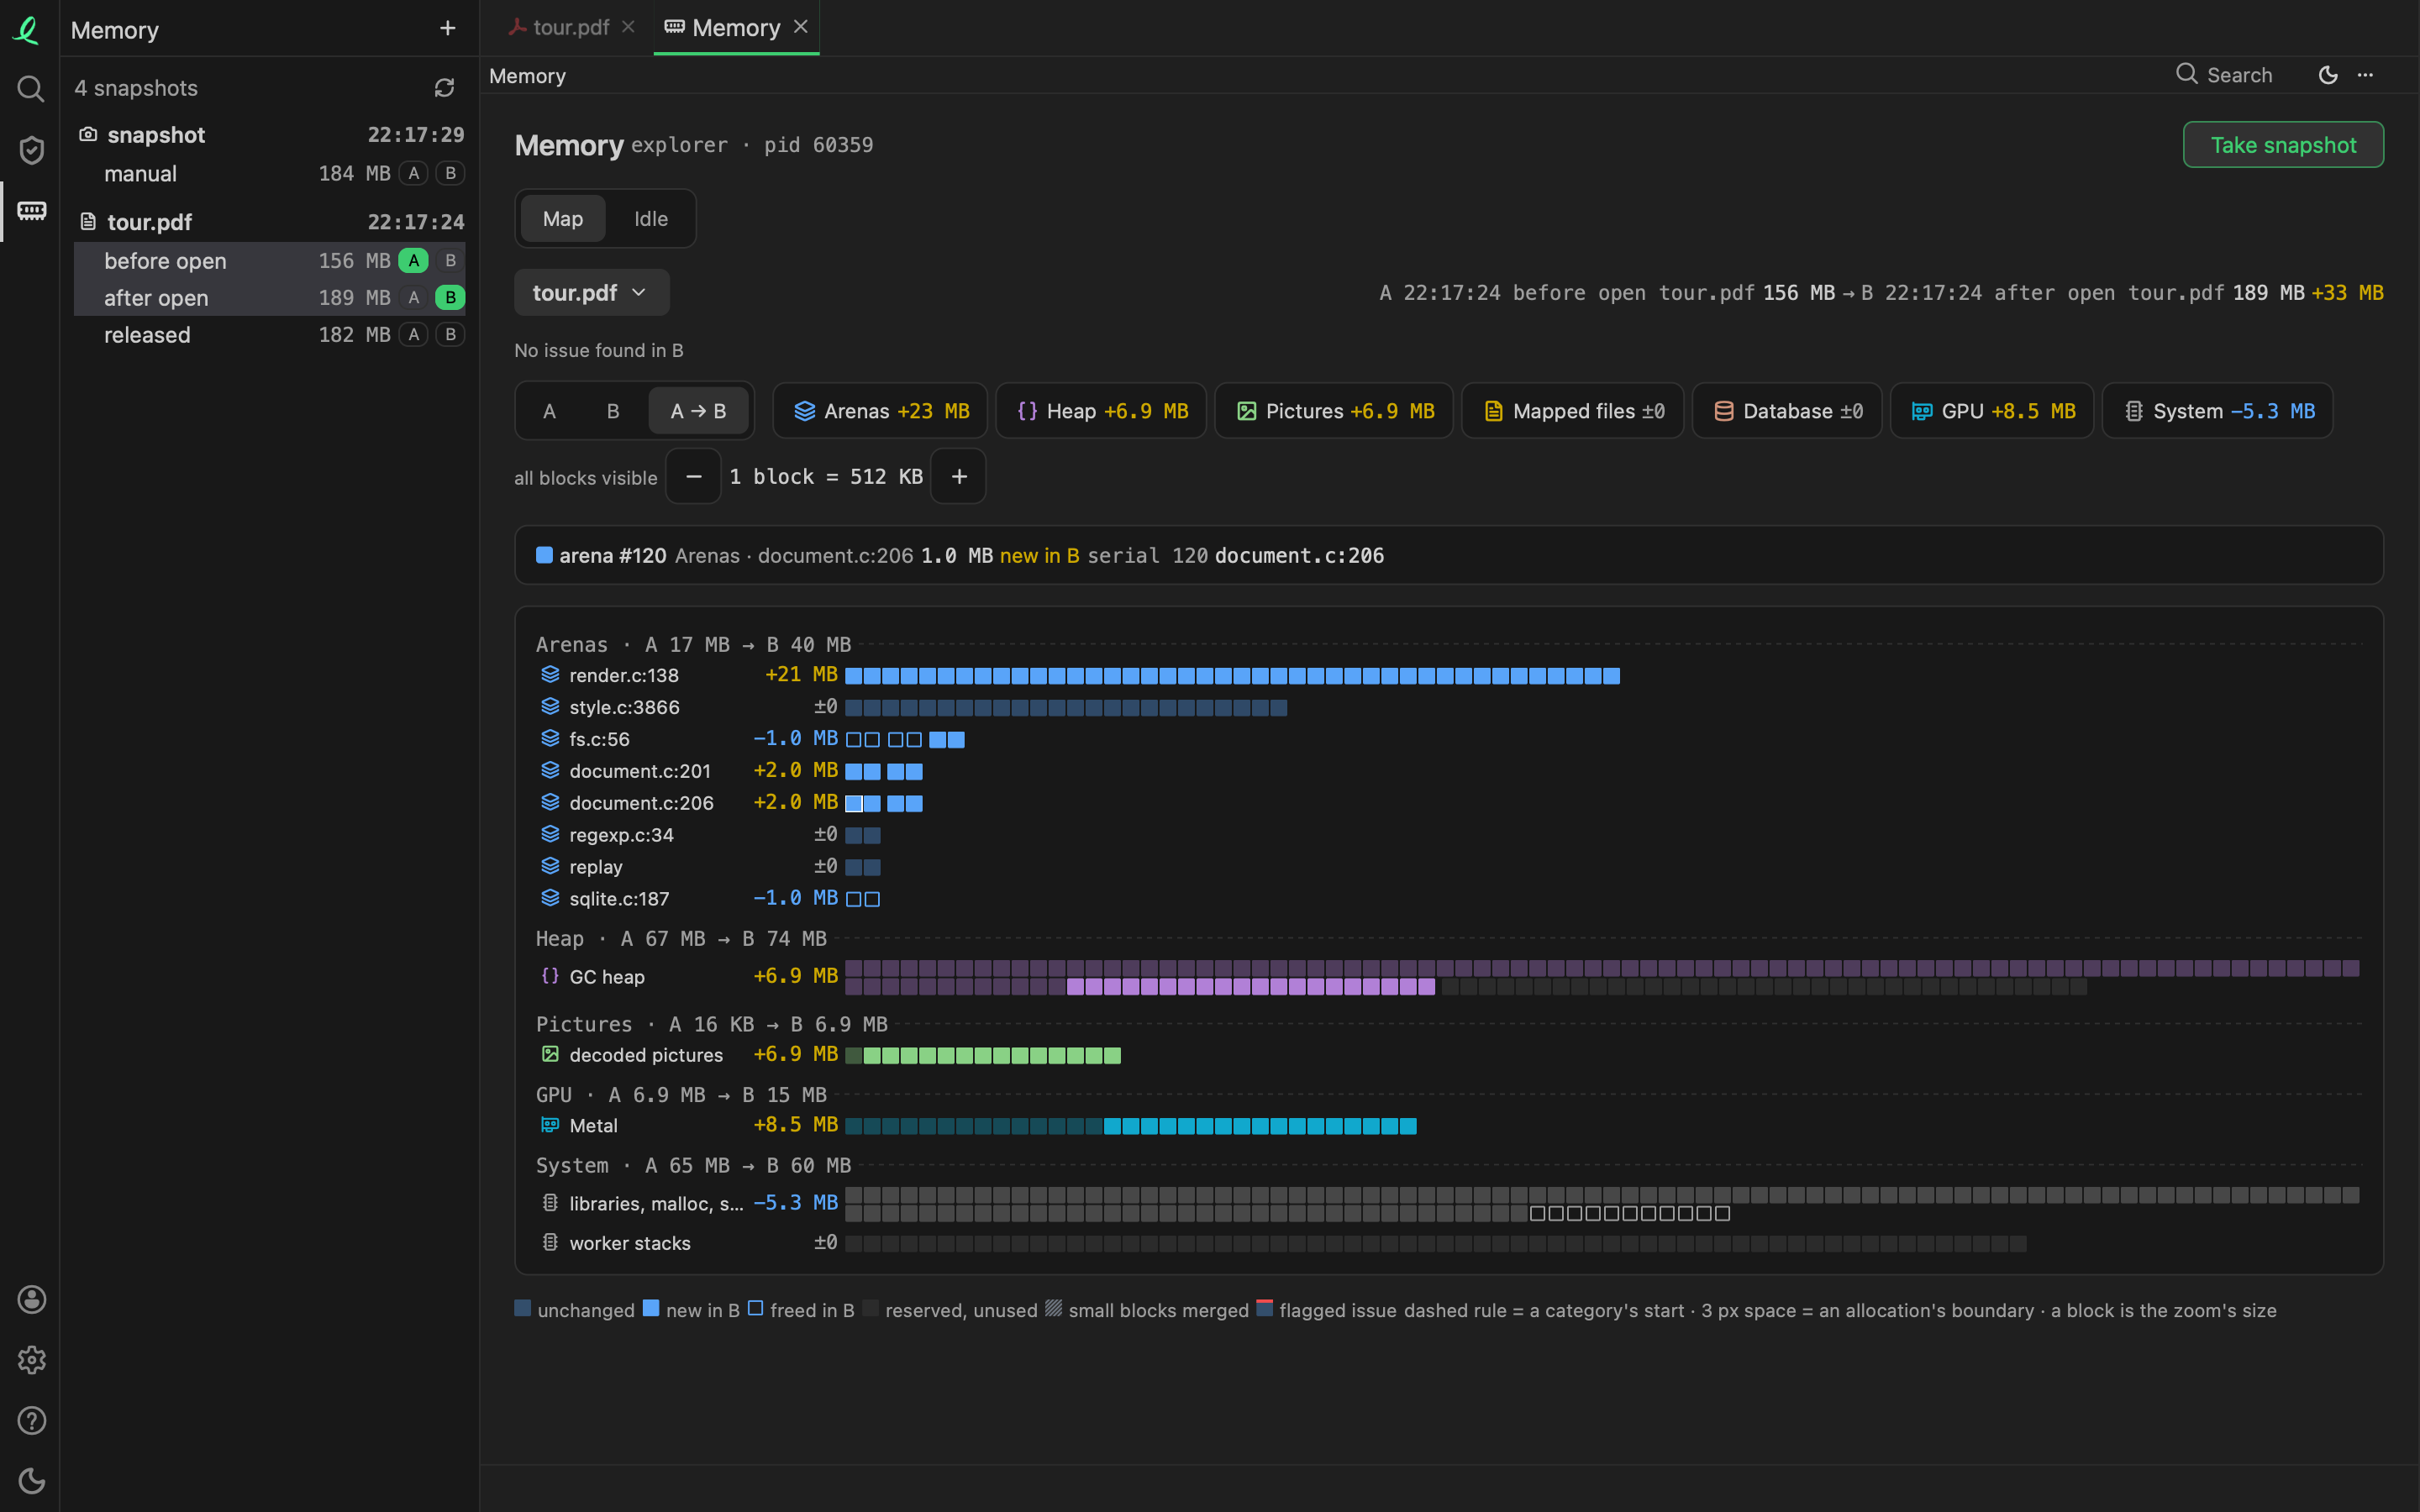
The side panel
Every file opened in a tab is measured three times: just before it opens (A), once its first screenful is drawn (B), and again after its tab is put away. The panel lists the files, newest first, with the snapshots taken around each. A click on a file compares its before and after; the A and B beside a snapshot pick it as that side. Take snapshot adds one of the moment, compared with the A already picked.
The map
A tab on memory:// draws the comparison:
- a band per region of memory: the app's own areas, the script heap, mapped files, the database, the graphics memory, and what is left of the footprint;
- in each band, a cell per step of megabytes: unchanged dim, new in B solid, freed in B outlined, reserved dark, small allocations merged and hatched, a flagged one red;
- A, B and A → B switch what is drawn, and a category clicked shows that one alone;
- the issues found in B are listed above the map.
With two panes each showing a file, the map draws two columns side by side, each pane's file against its own before.
Idle
The Idle tab draws the footprint, the script heap and the decoded pictures over time, from a snapshot taken every 30 seconds while no file is being opened. The last 1,000 are kept.
The memory limit
The app looks at its own footprint once a second. Over its limit, half the machine's memory, it first gives back what it can: decoded pictures, and the script heap collected. Still over a second later, a bar at the top of the window says how much it uses, with Close other tabs. It goes away once the footprint is under the limit again.
How long each opening took, and what it cost, is also what the cache pane lists as the slowest openings. All of it stays in ~/.objectexplorer/explorer.db.